Click on image to zoom and click on caption to read the description
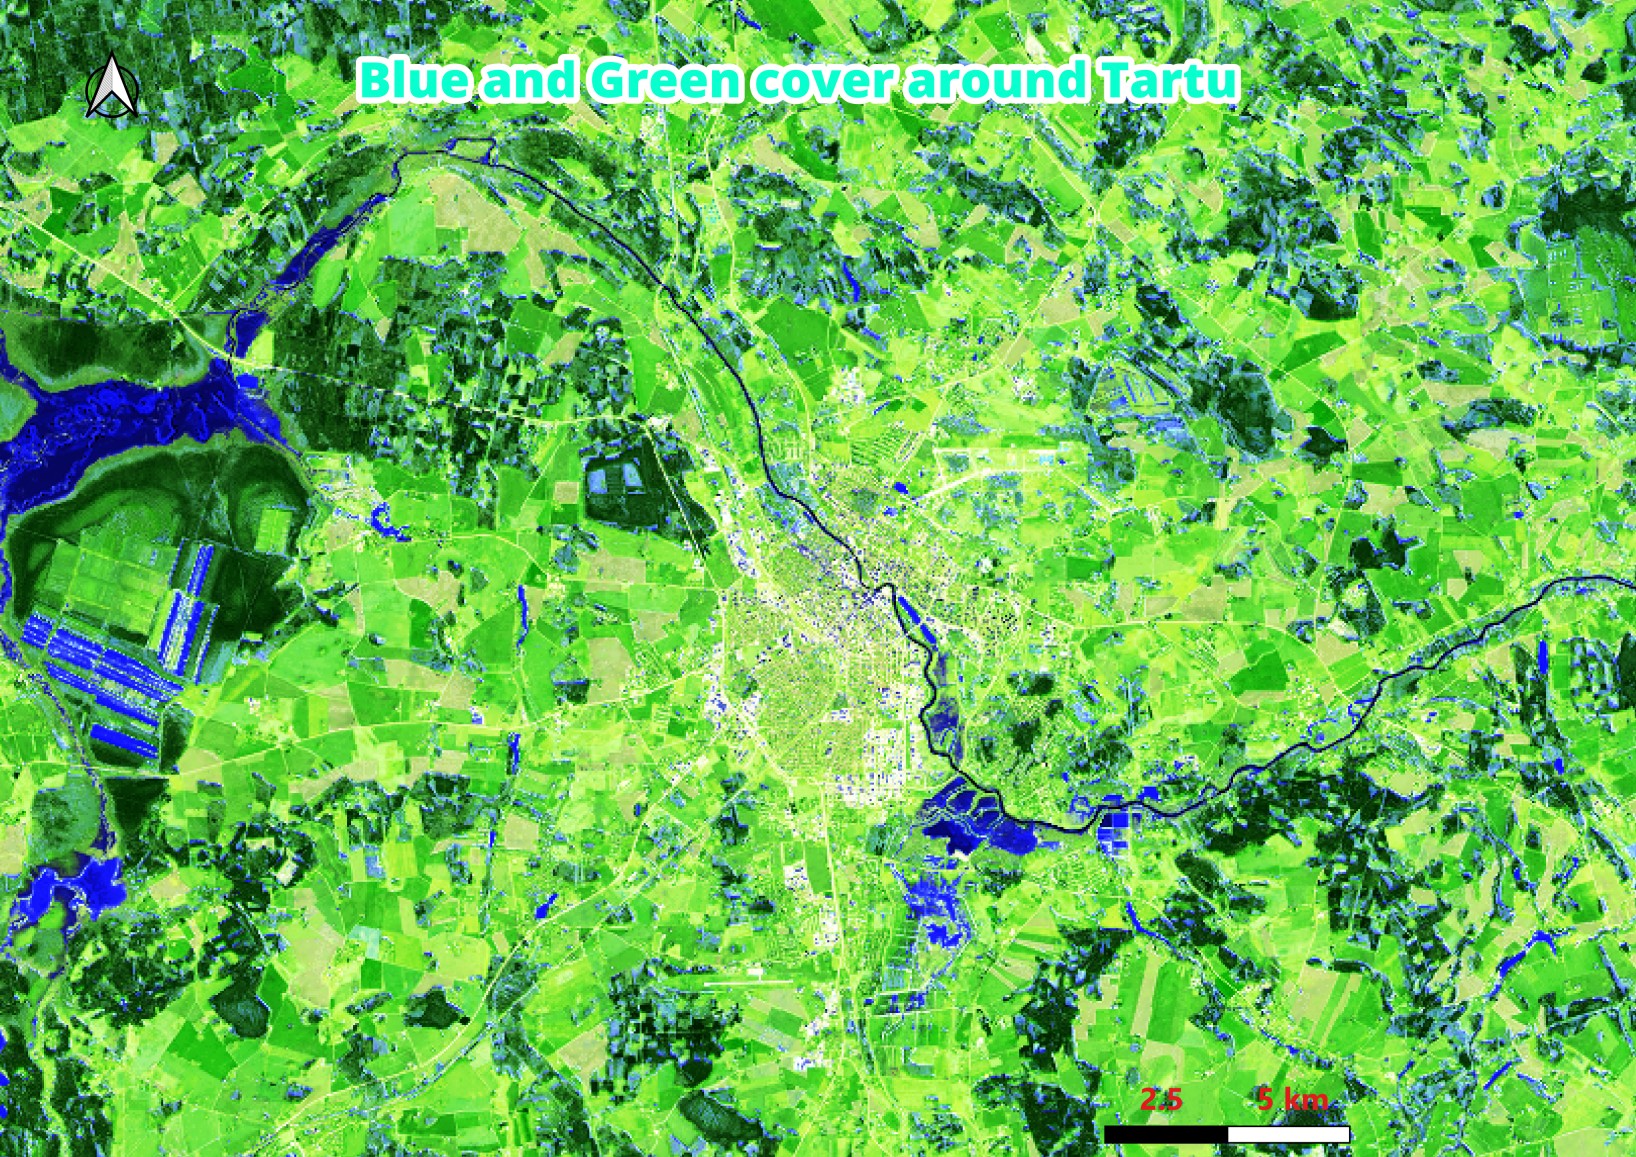
Prajwal Parmar, CEPT University
The map is created by using the overlay effect in QGIS. NDWI, NDVI and Urban False color composite were retrieved from Sentinel Hub (EO Browser). The base layer is the urban false color composite and the other two layers are on top of the base layer but using the overlay effect in the symbology I have tried to enhance the water bodies and green cover.
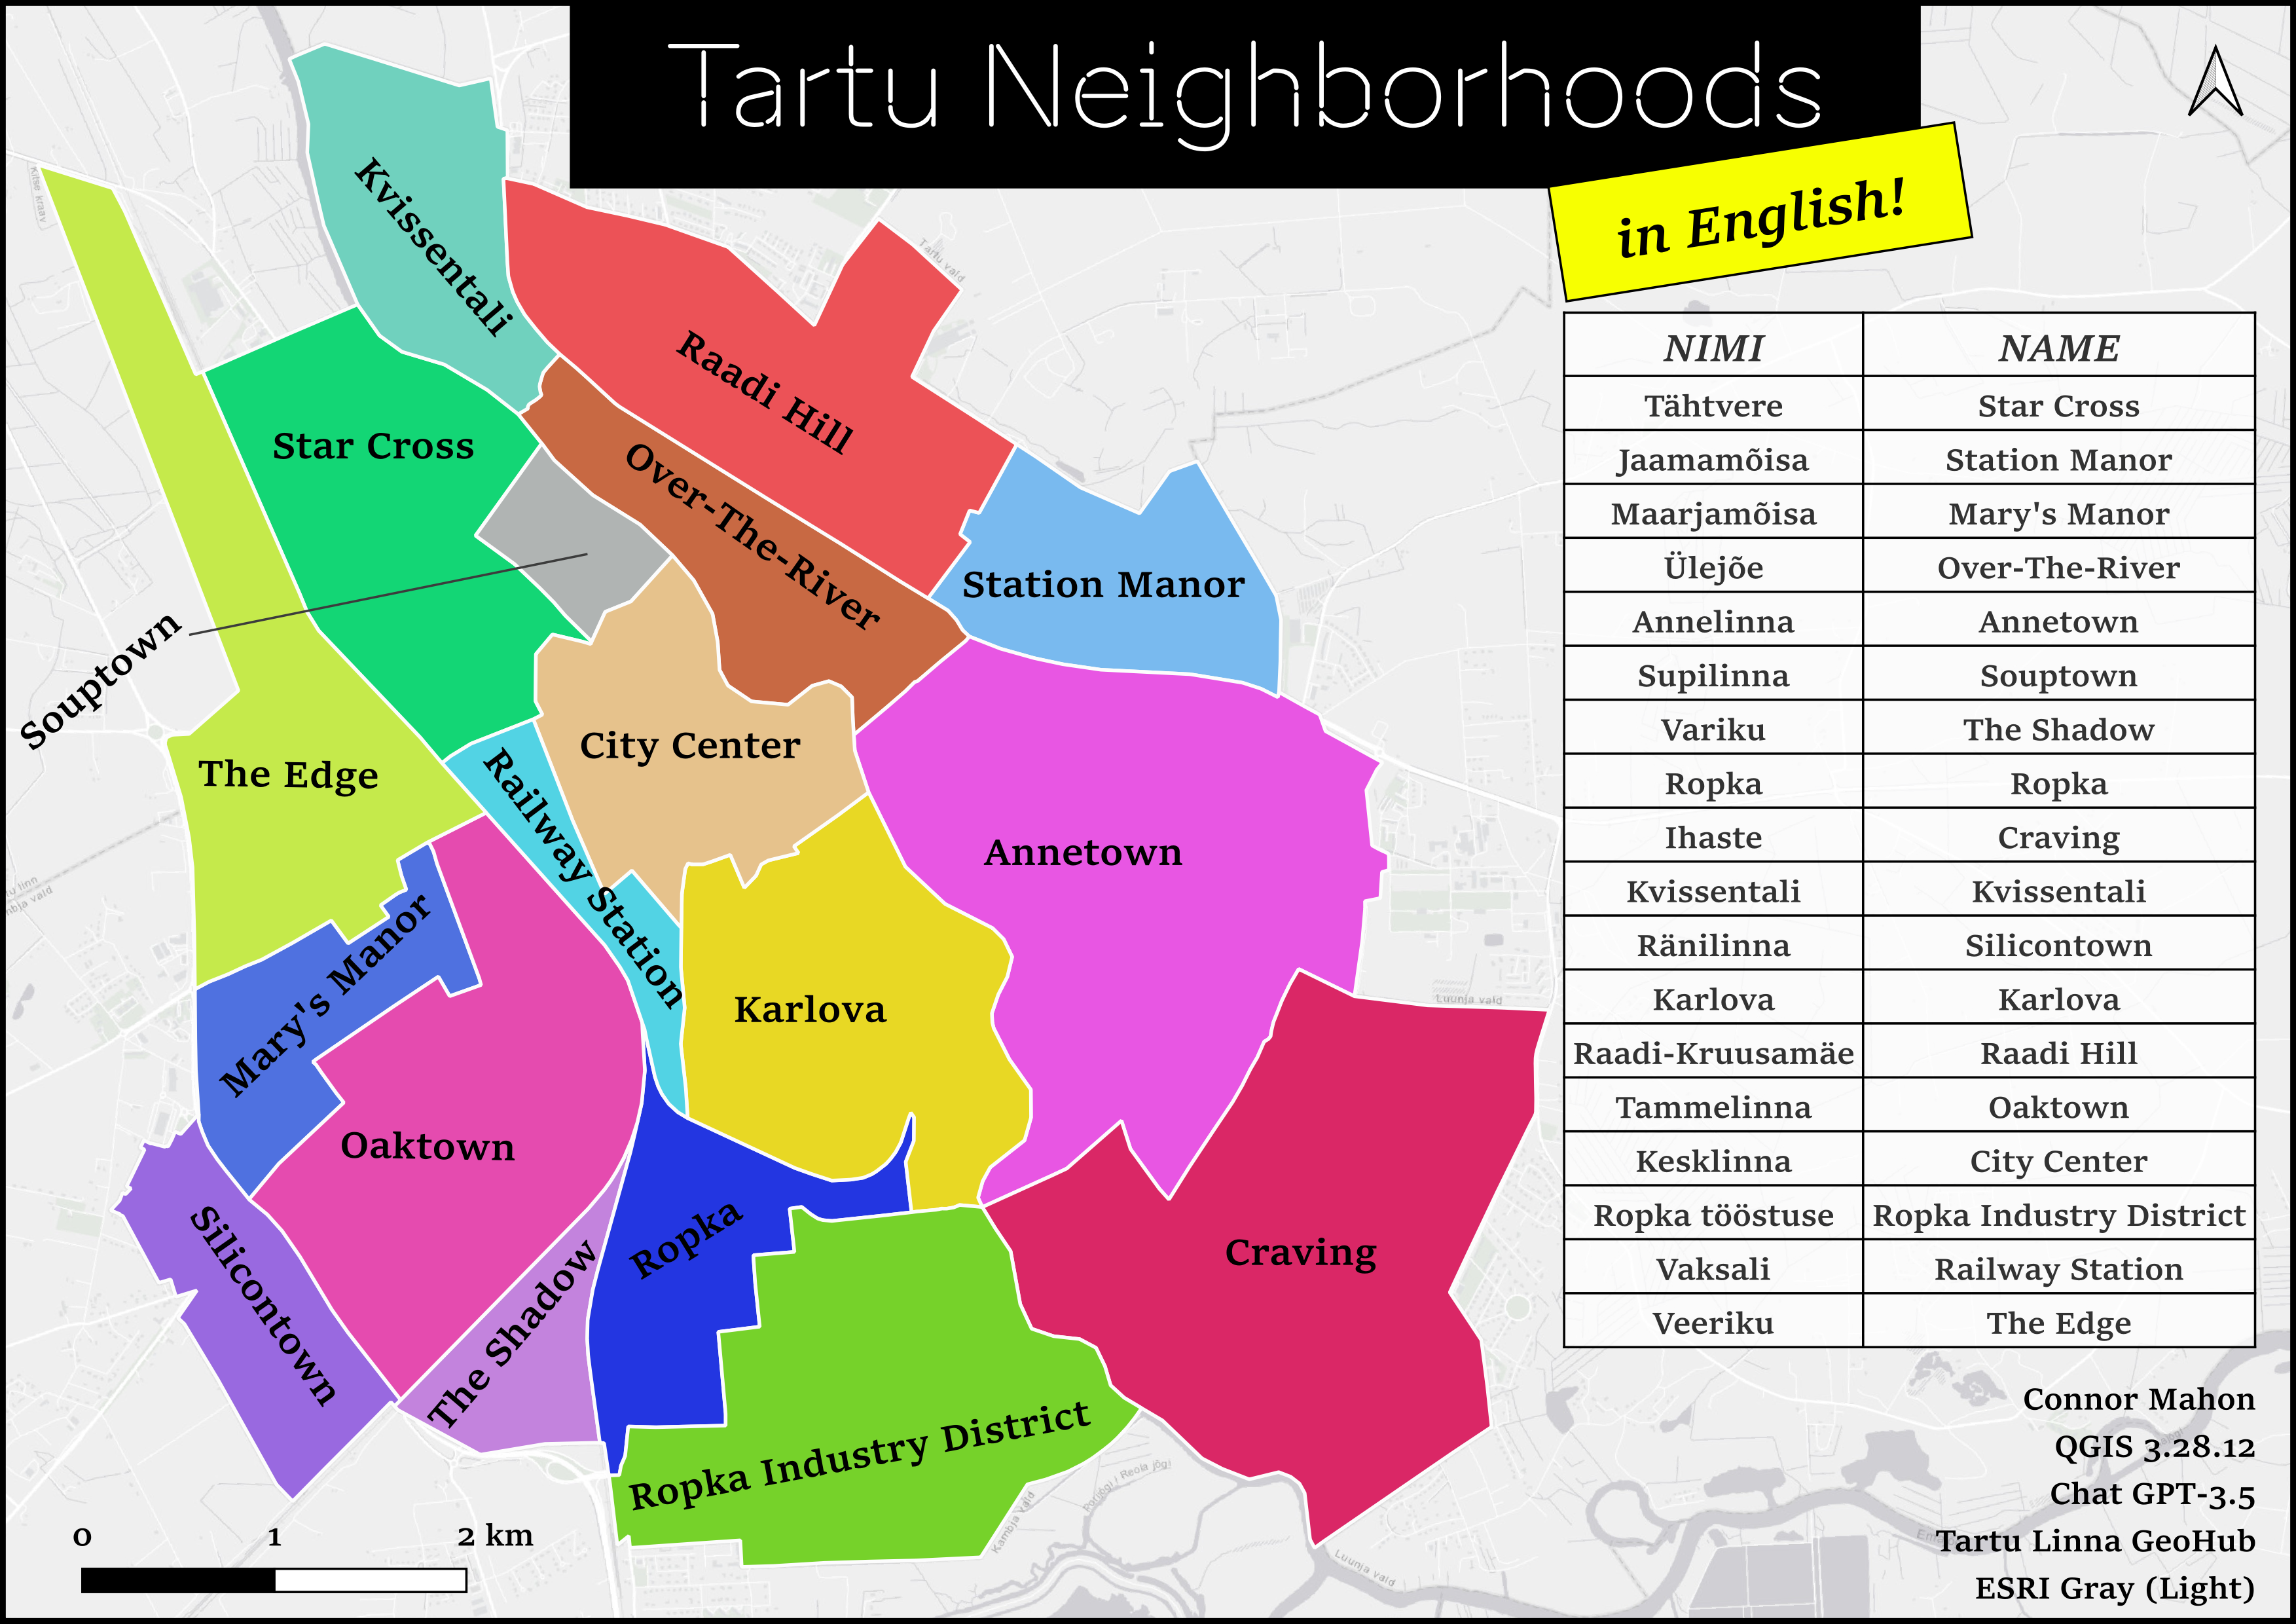
Connor Mahon, University of Tartu
The Estonian language is a beautiful and unique language. However, I thought it would be interesting to understand what each neighborhood in Tartu meant in English. I added a base map from ESRI Gray (light) in QGIS 3.28.12. For the neighborhood boundaries, I used Tartu Linna geohub. To find the translations, I posited the neighborhood names in Chat-GPT 3.5. The map is the result of this query.
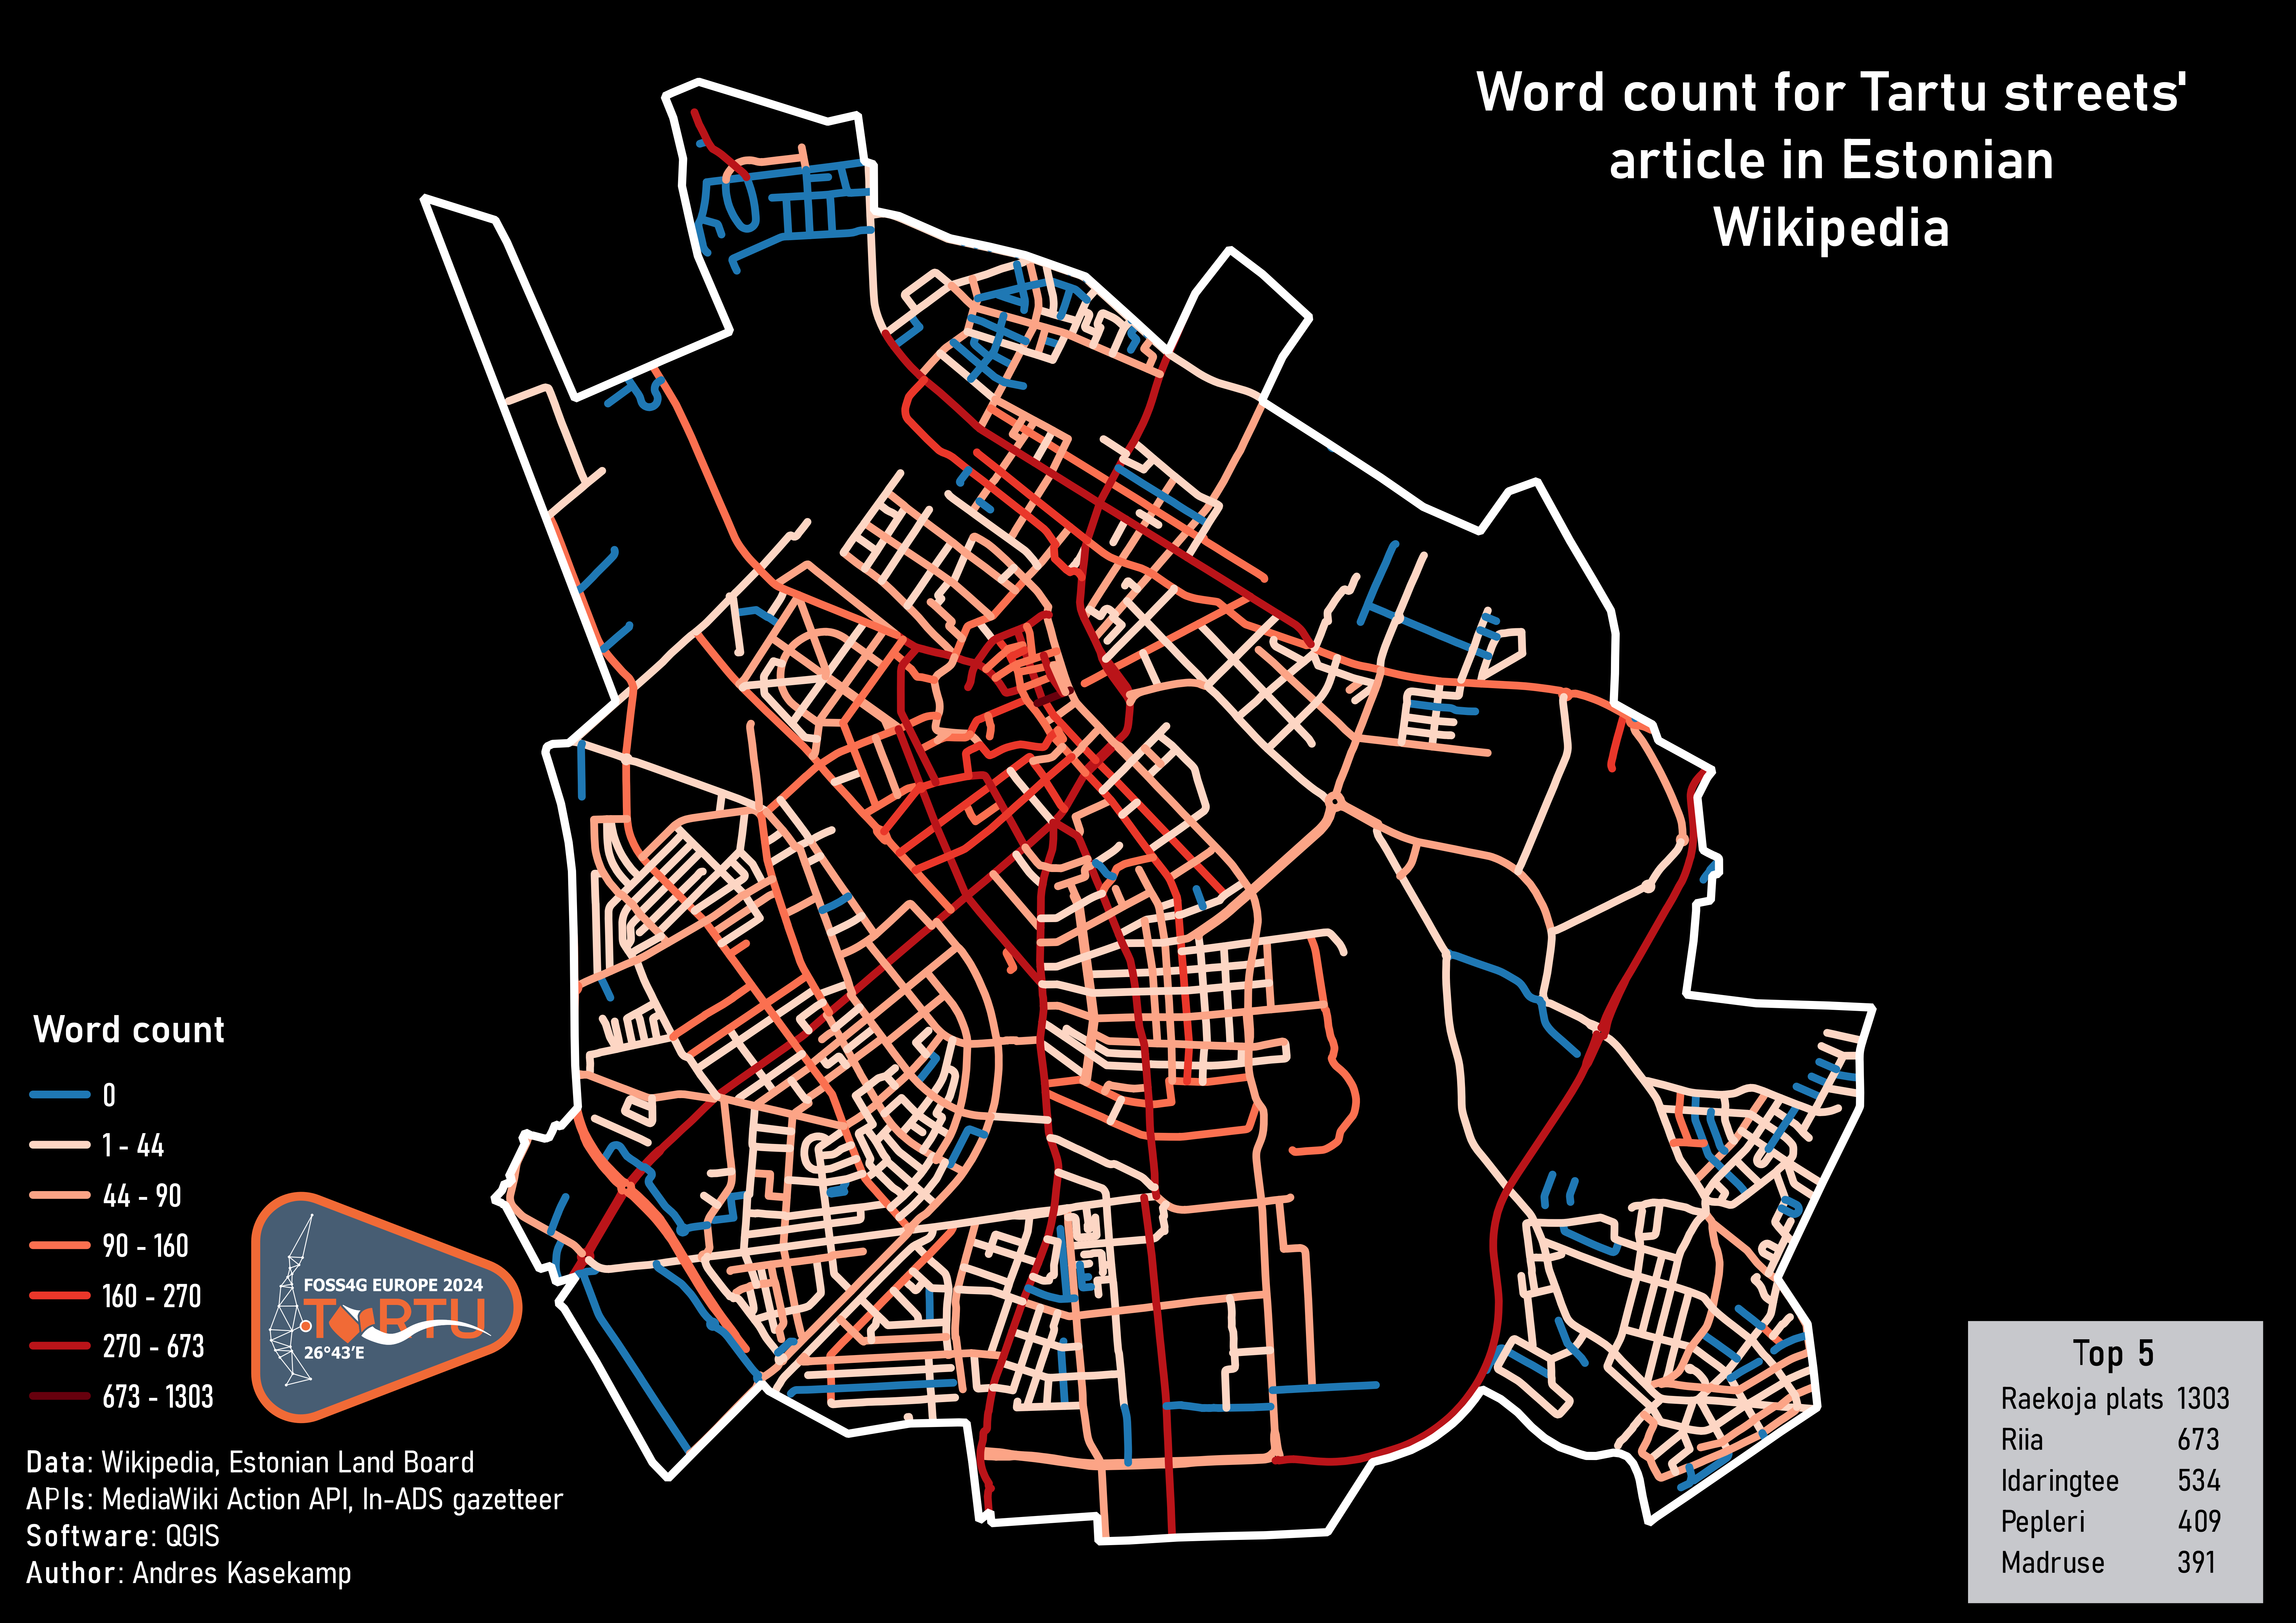
Andres Kasekamp, Estonian Land Board
The following map's data is from the Estonian Wikipedia (Vikipeedia) and Estonian Land Board (Maa-amet). The streets' article was found using the MediaWiki Action API and street geometries are from the Estonian Topographic Database (ETAK). The In-ads gazetteer service was used to link these two data sources together. The API requests were done using Requests and Aiohttp libraries, data processing was handled with GeoPandas, and the visualization was created using QGIS 3.32.
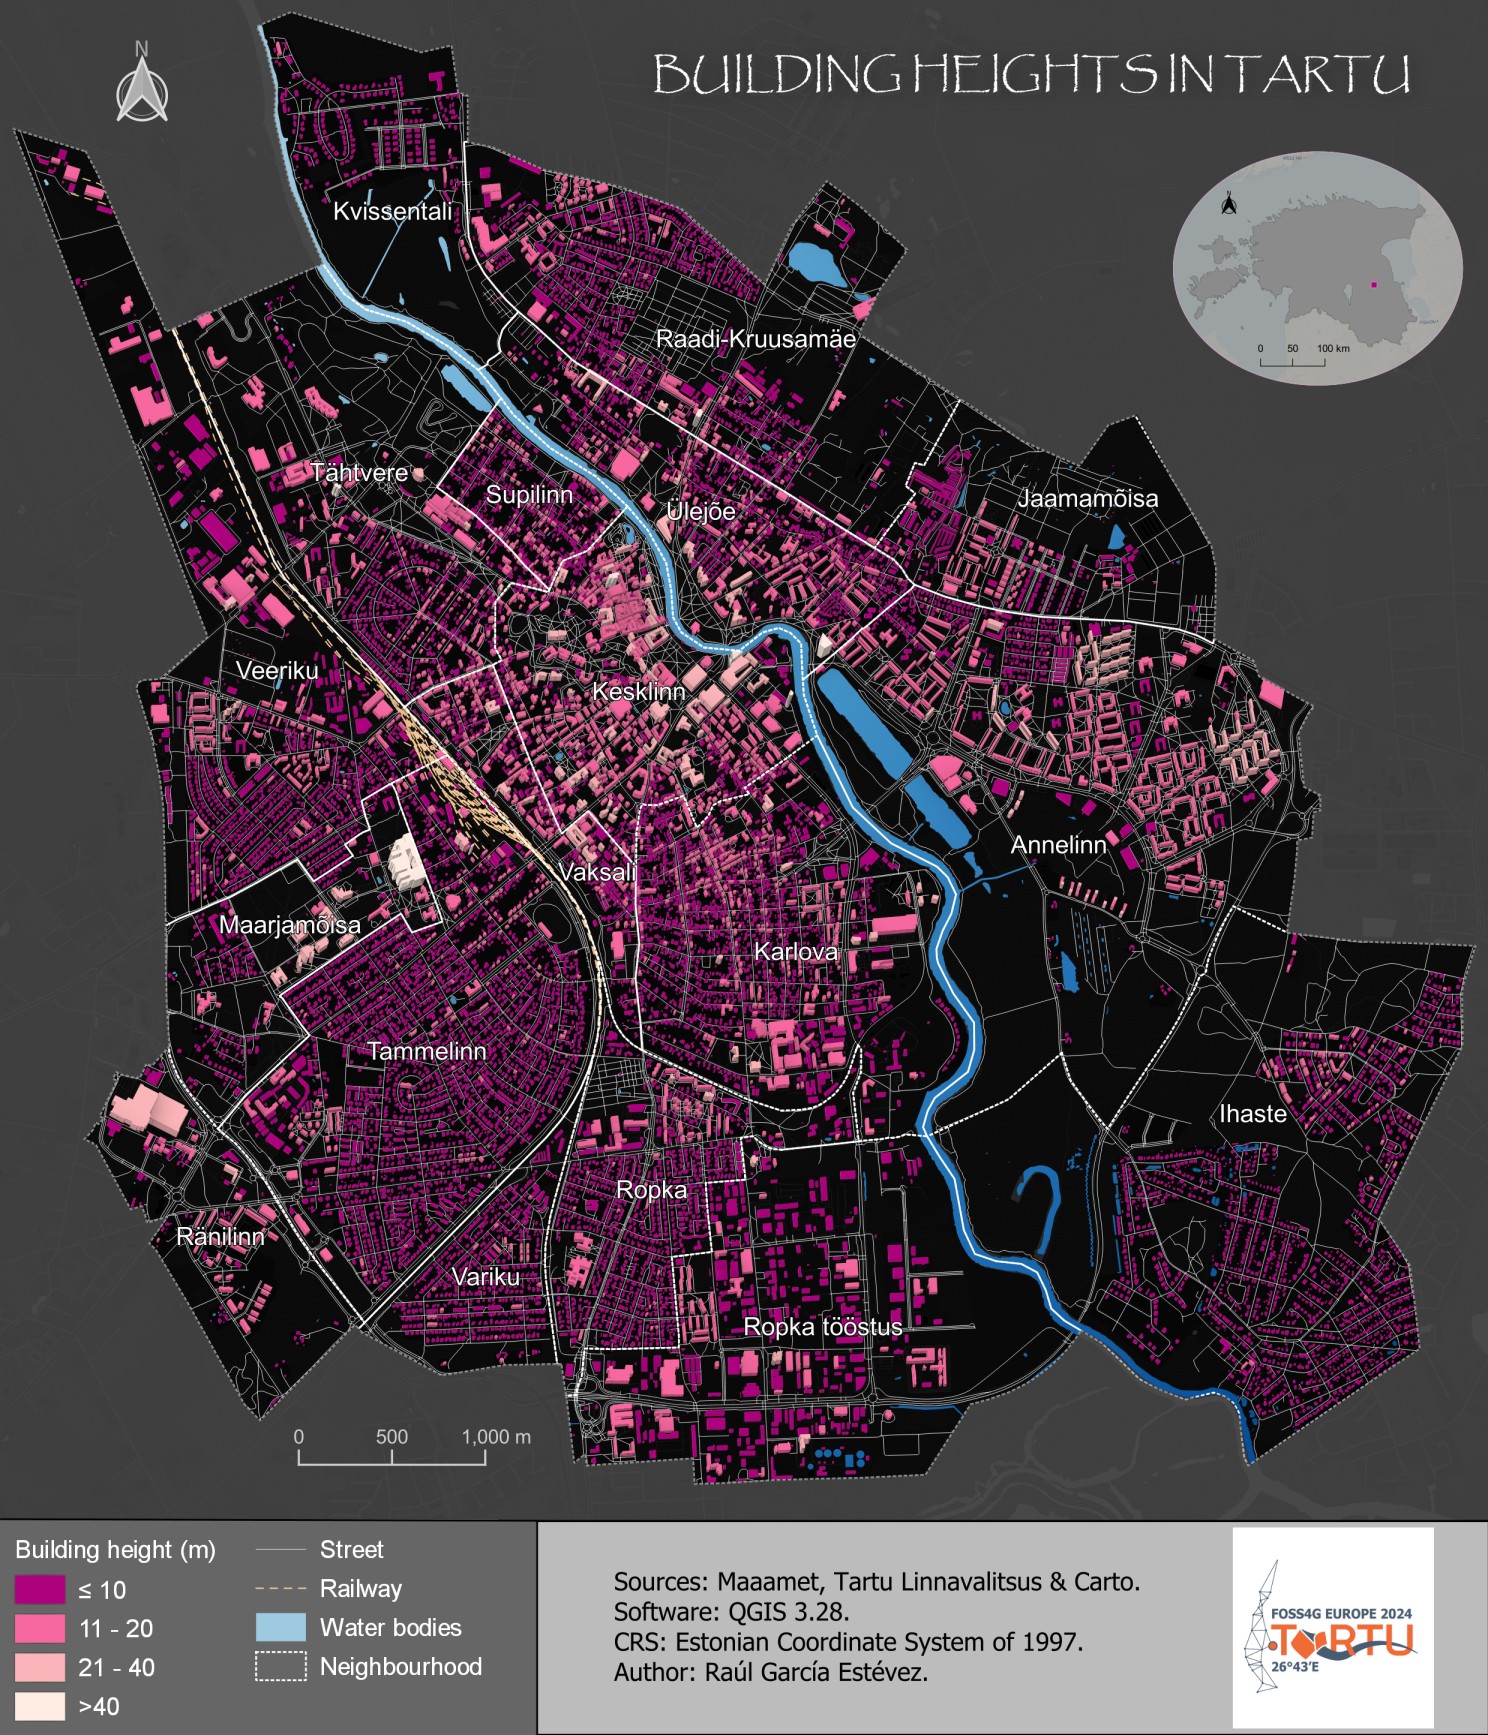
Raúl García Estévez, University of Tartu
The following map is a 3D visualization of the urban landscape in Tartu, Estonia. The main dataset employed is the buildings from Estonian Land Board (Maa-amet). As background information roads (Maa-amet) and city districts (Tartu City Government) were used. The map was created in QGIS, combining 2.5D symbols and height classification using the height attribute from the original dataset to create a realistic representation of the urban environment.
Raul Garcia Estevez, Tartu University
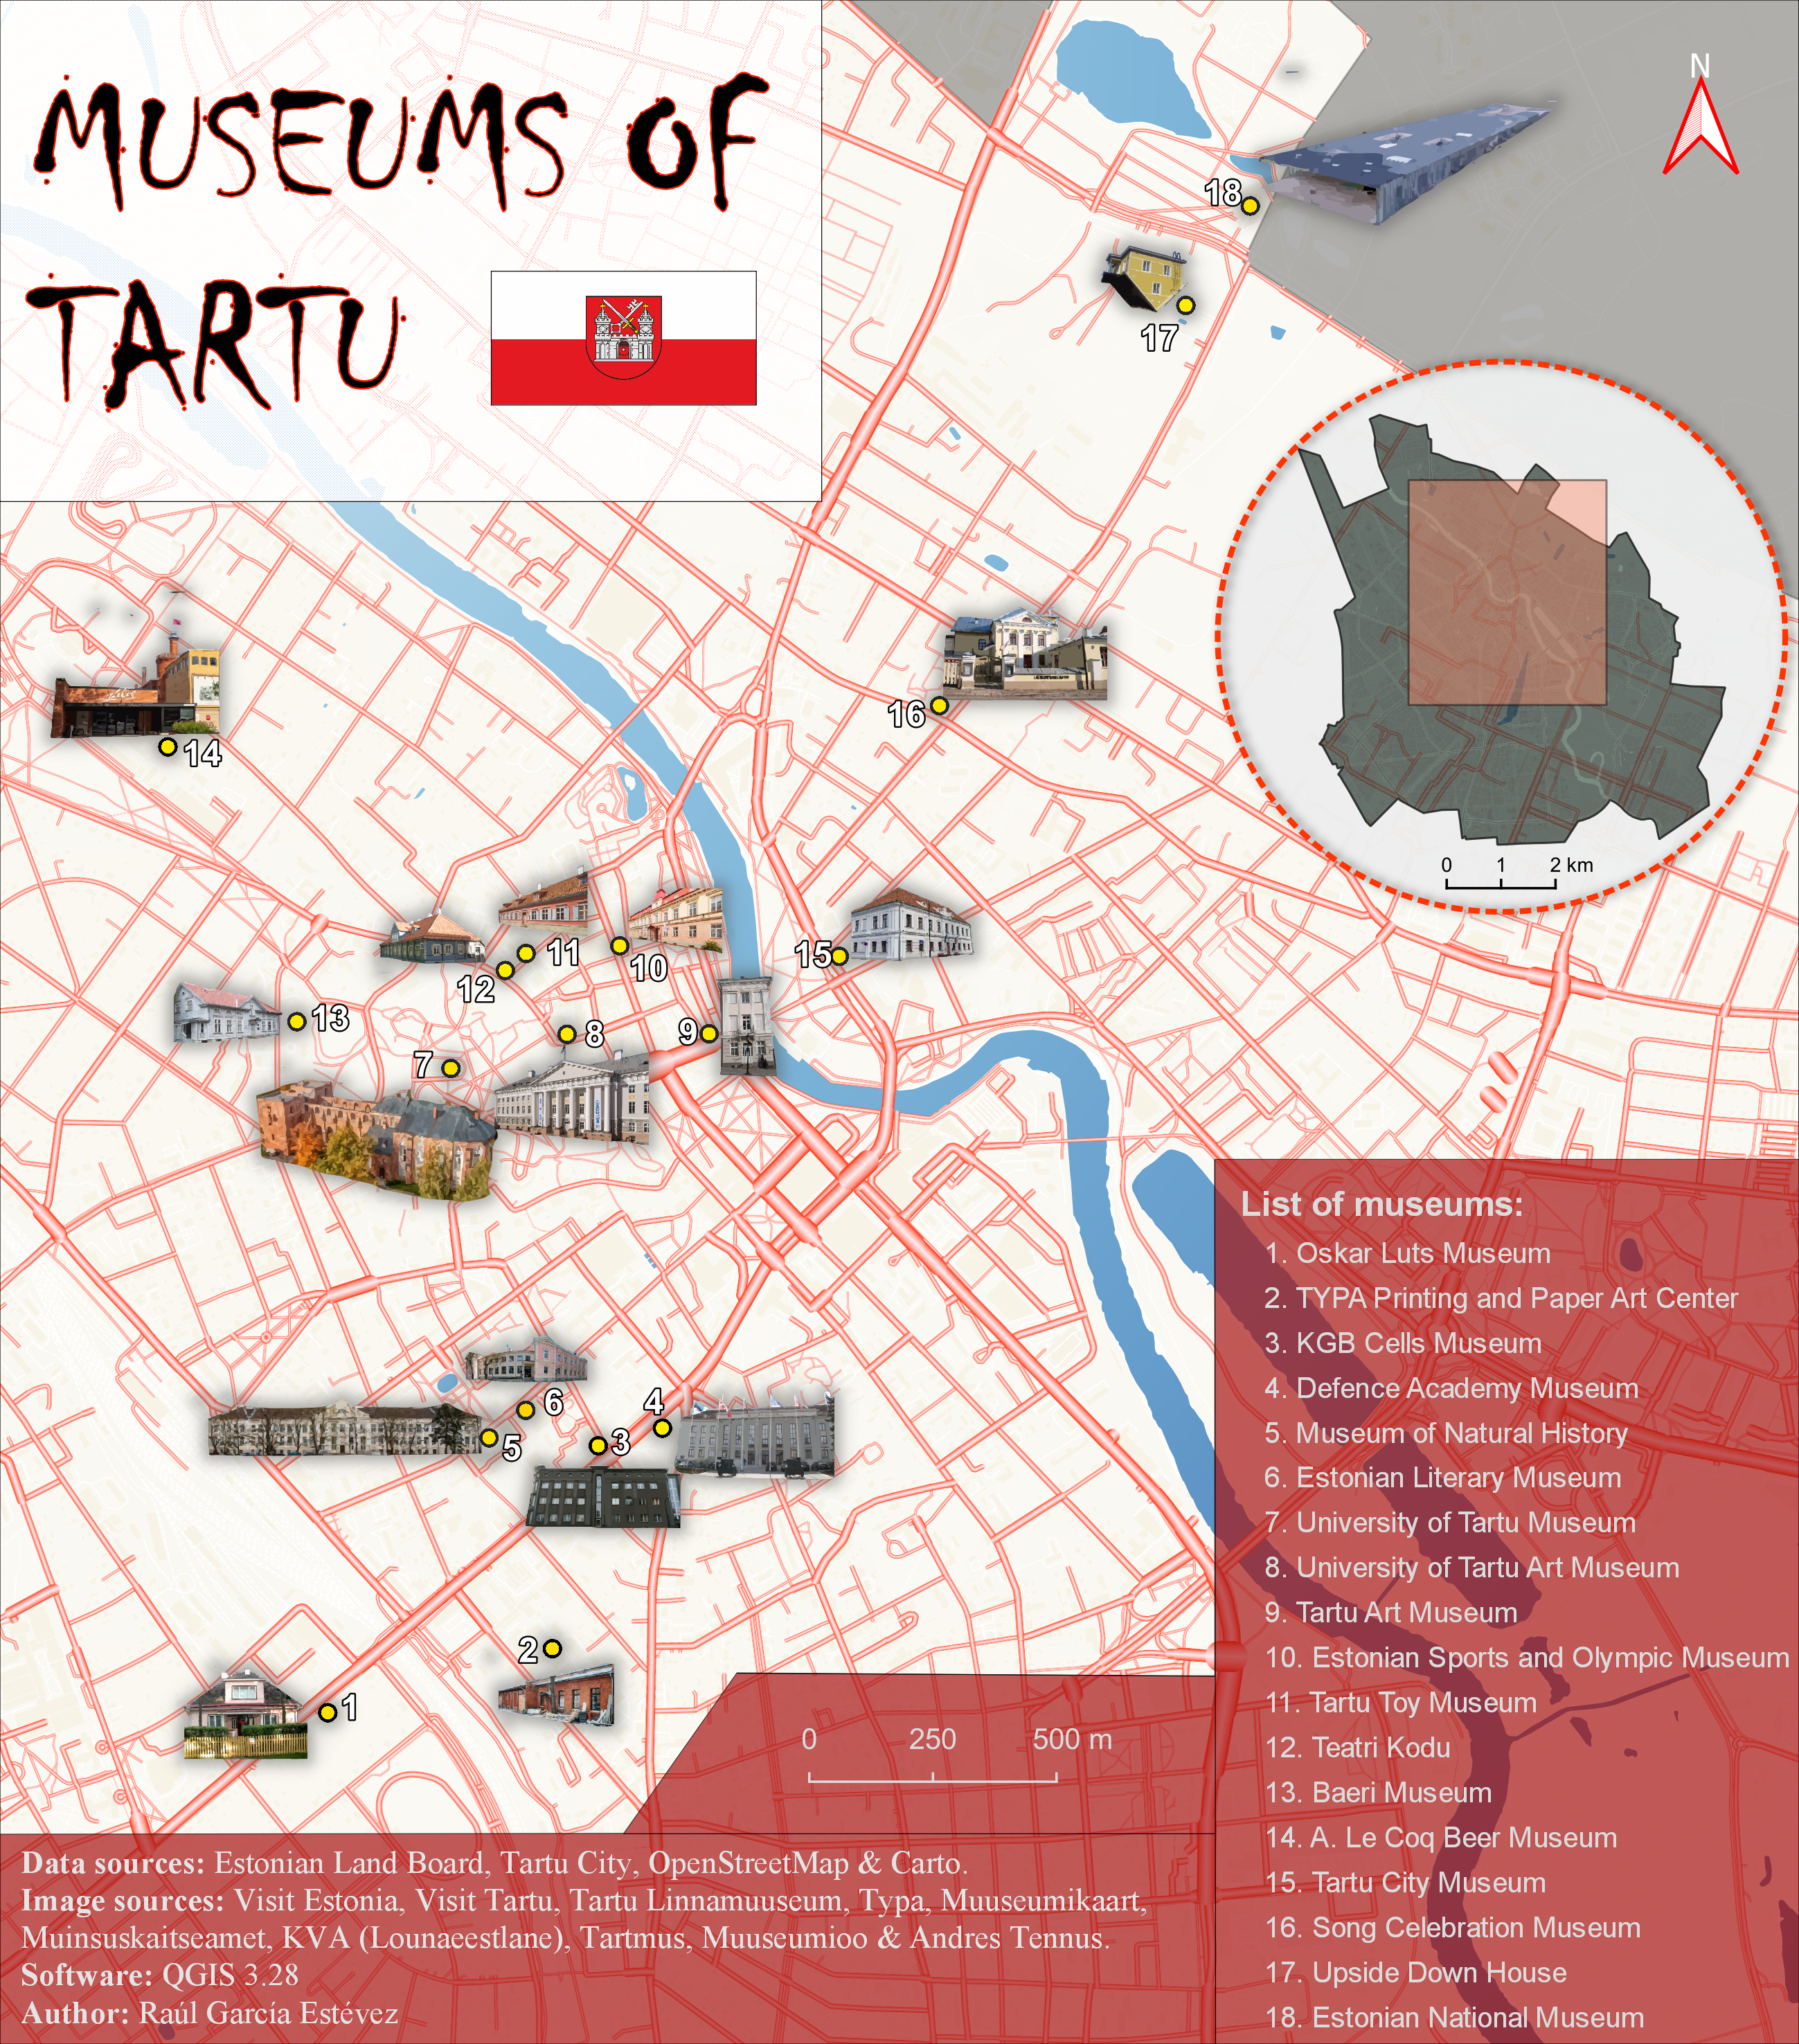
The following map is a visualisation of the museums of Tartu, Estonia. The main dataset employed is a point dataset of museums extracted from OSM using OSMNX library in Python. As background information roads and city border (Maaamet) were used. The map was created in QGIS, using the street width attribute from the original road data and images from several data sources that were previously converted into svg.
Ayisha Yusibova
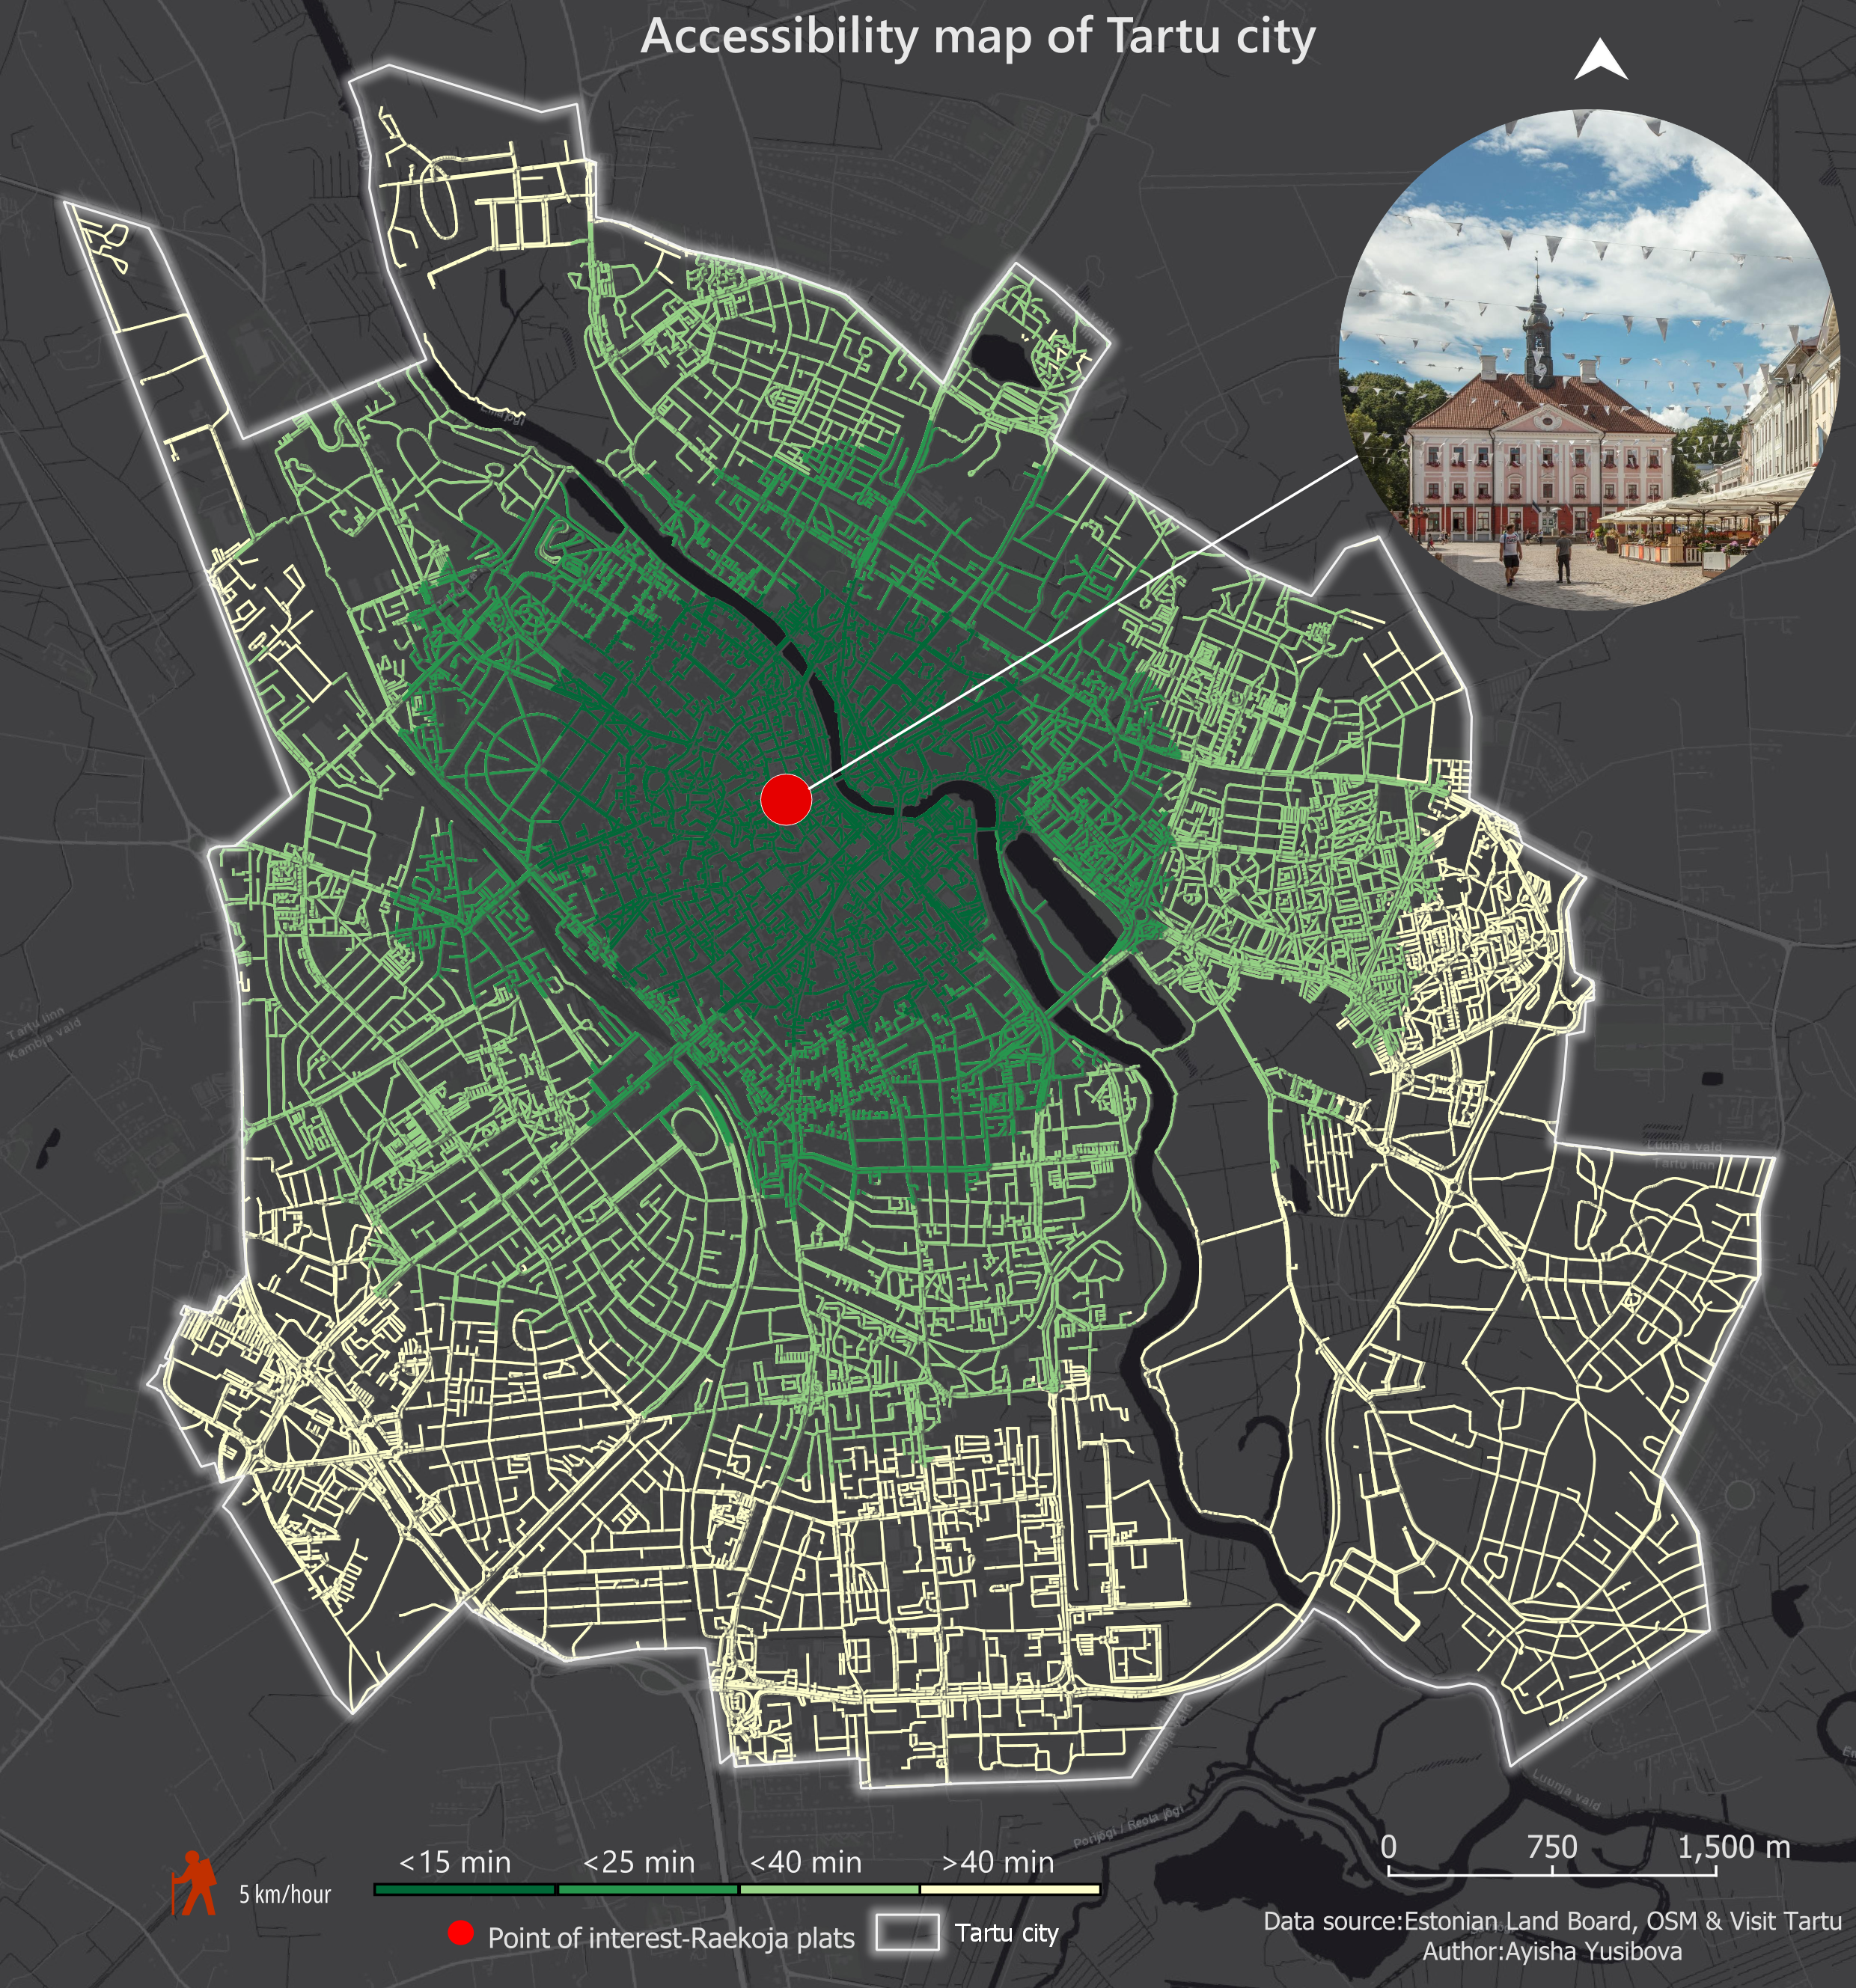
The map indicates the walking time from the city center of Tartu (Raekoja plats). The data used is from open-source datasets, including roads from OpenStreetMap (OSM) and city boundaries from the Estonian Land Board. Spatial data analysis was carried out using the Network Analysis tools in QGIS. The average pedestrian speed was considered to be 5 km/h, and based on this, four time intervals were calculated and merged together. As a final step, the network data was classified according to these time intervals and visualized.
Lika Zhvania, University of Augsburg
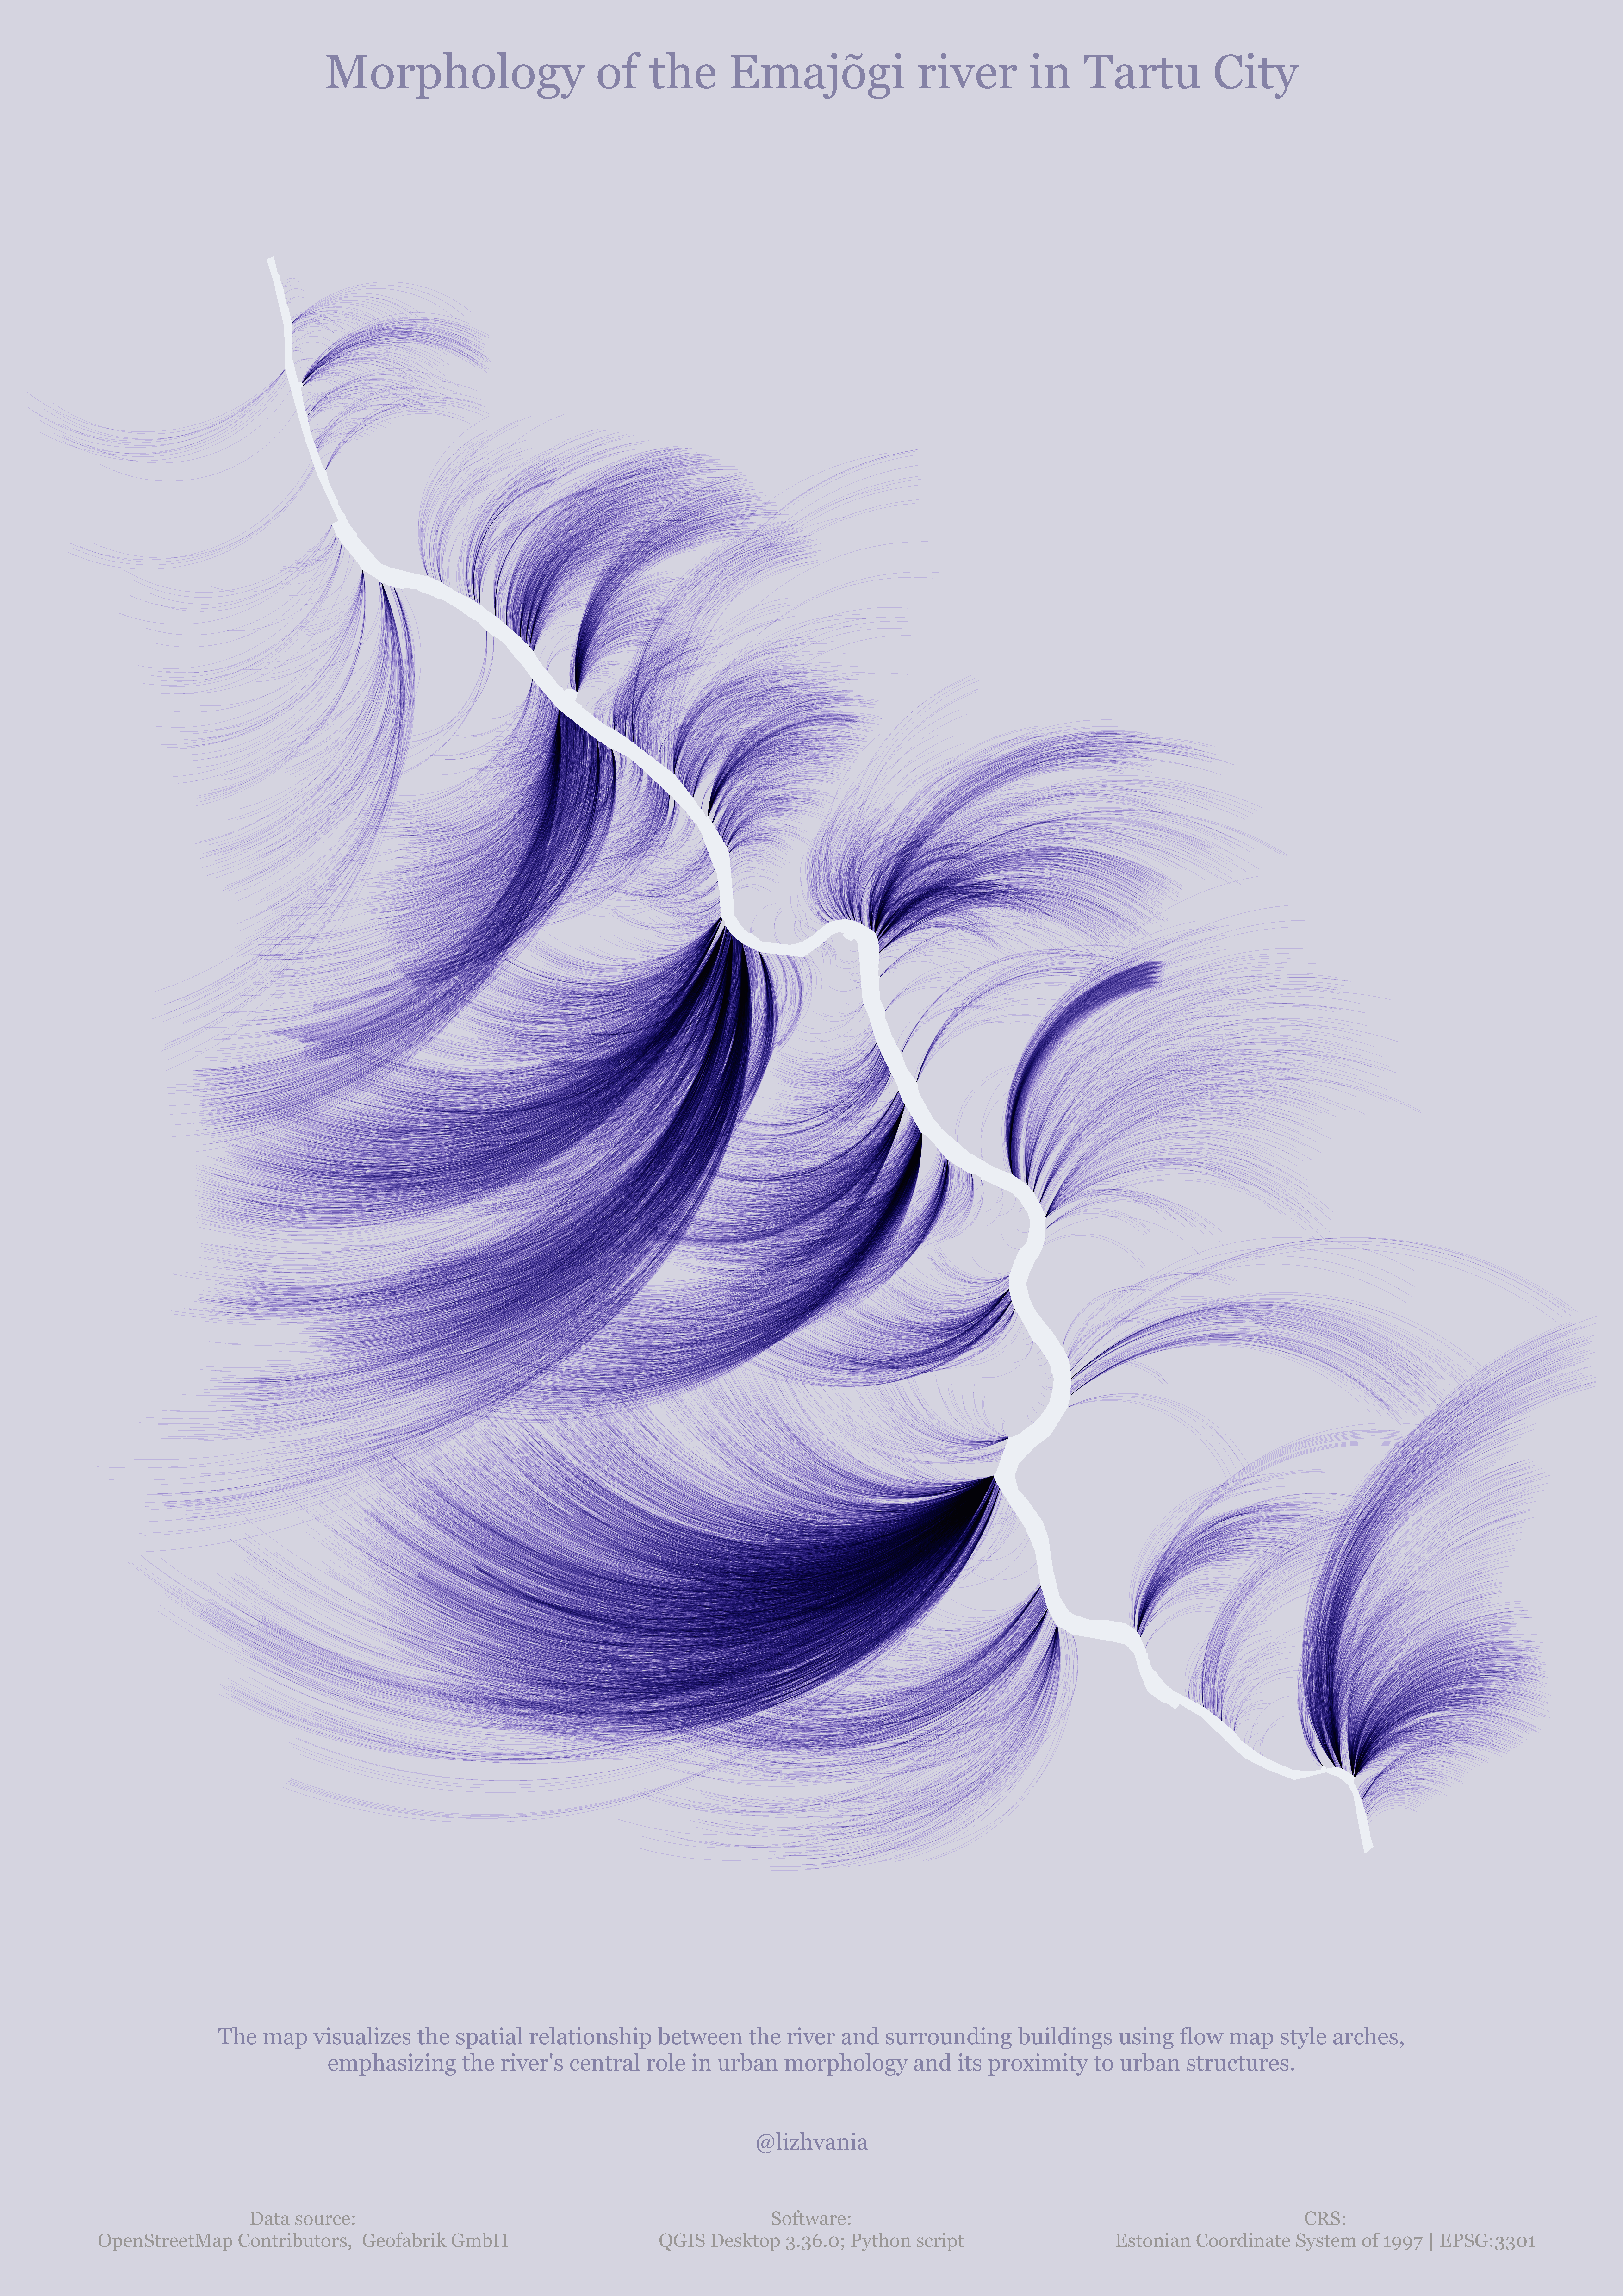
For the map creation, data was sourced from OpenStreetMap. The Tartu City boundary was obtained using the 'OSM place search' tool in QGIS, while the rest of the data was downloaded from Geofabrik. The entire process of data preparation, processing, and map creation was conducted using QGIS Desktop and Python scripting. QGIS's geoprocessing tools were utilized for data preparation, and Python scripts in QGIS's Python Console were used to create the connections between the river and buildings. Symbolization techniques in QGIS were applied for the final map. The map is conceptual rather than analytical, with a minimalistic design and a color scheme inspired by blueberries.
Kirke Narusk, Maa-amet (Estonian Land Board)
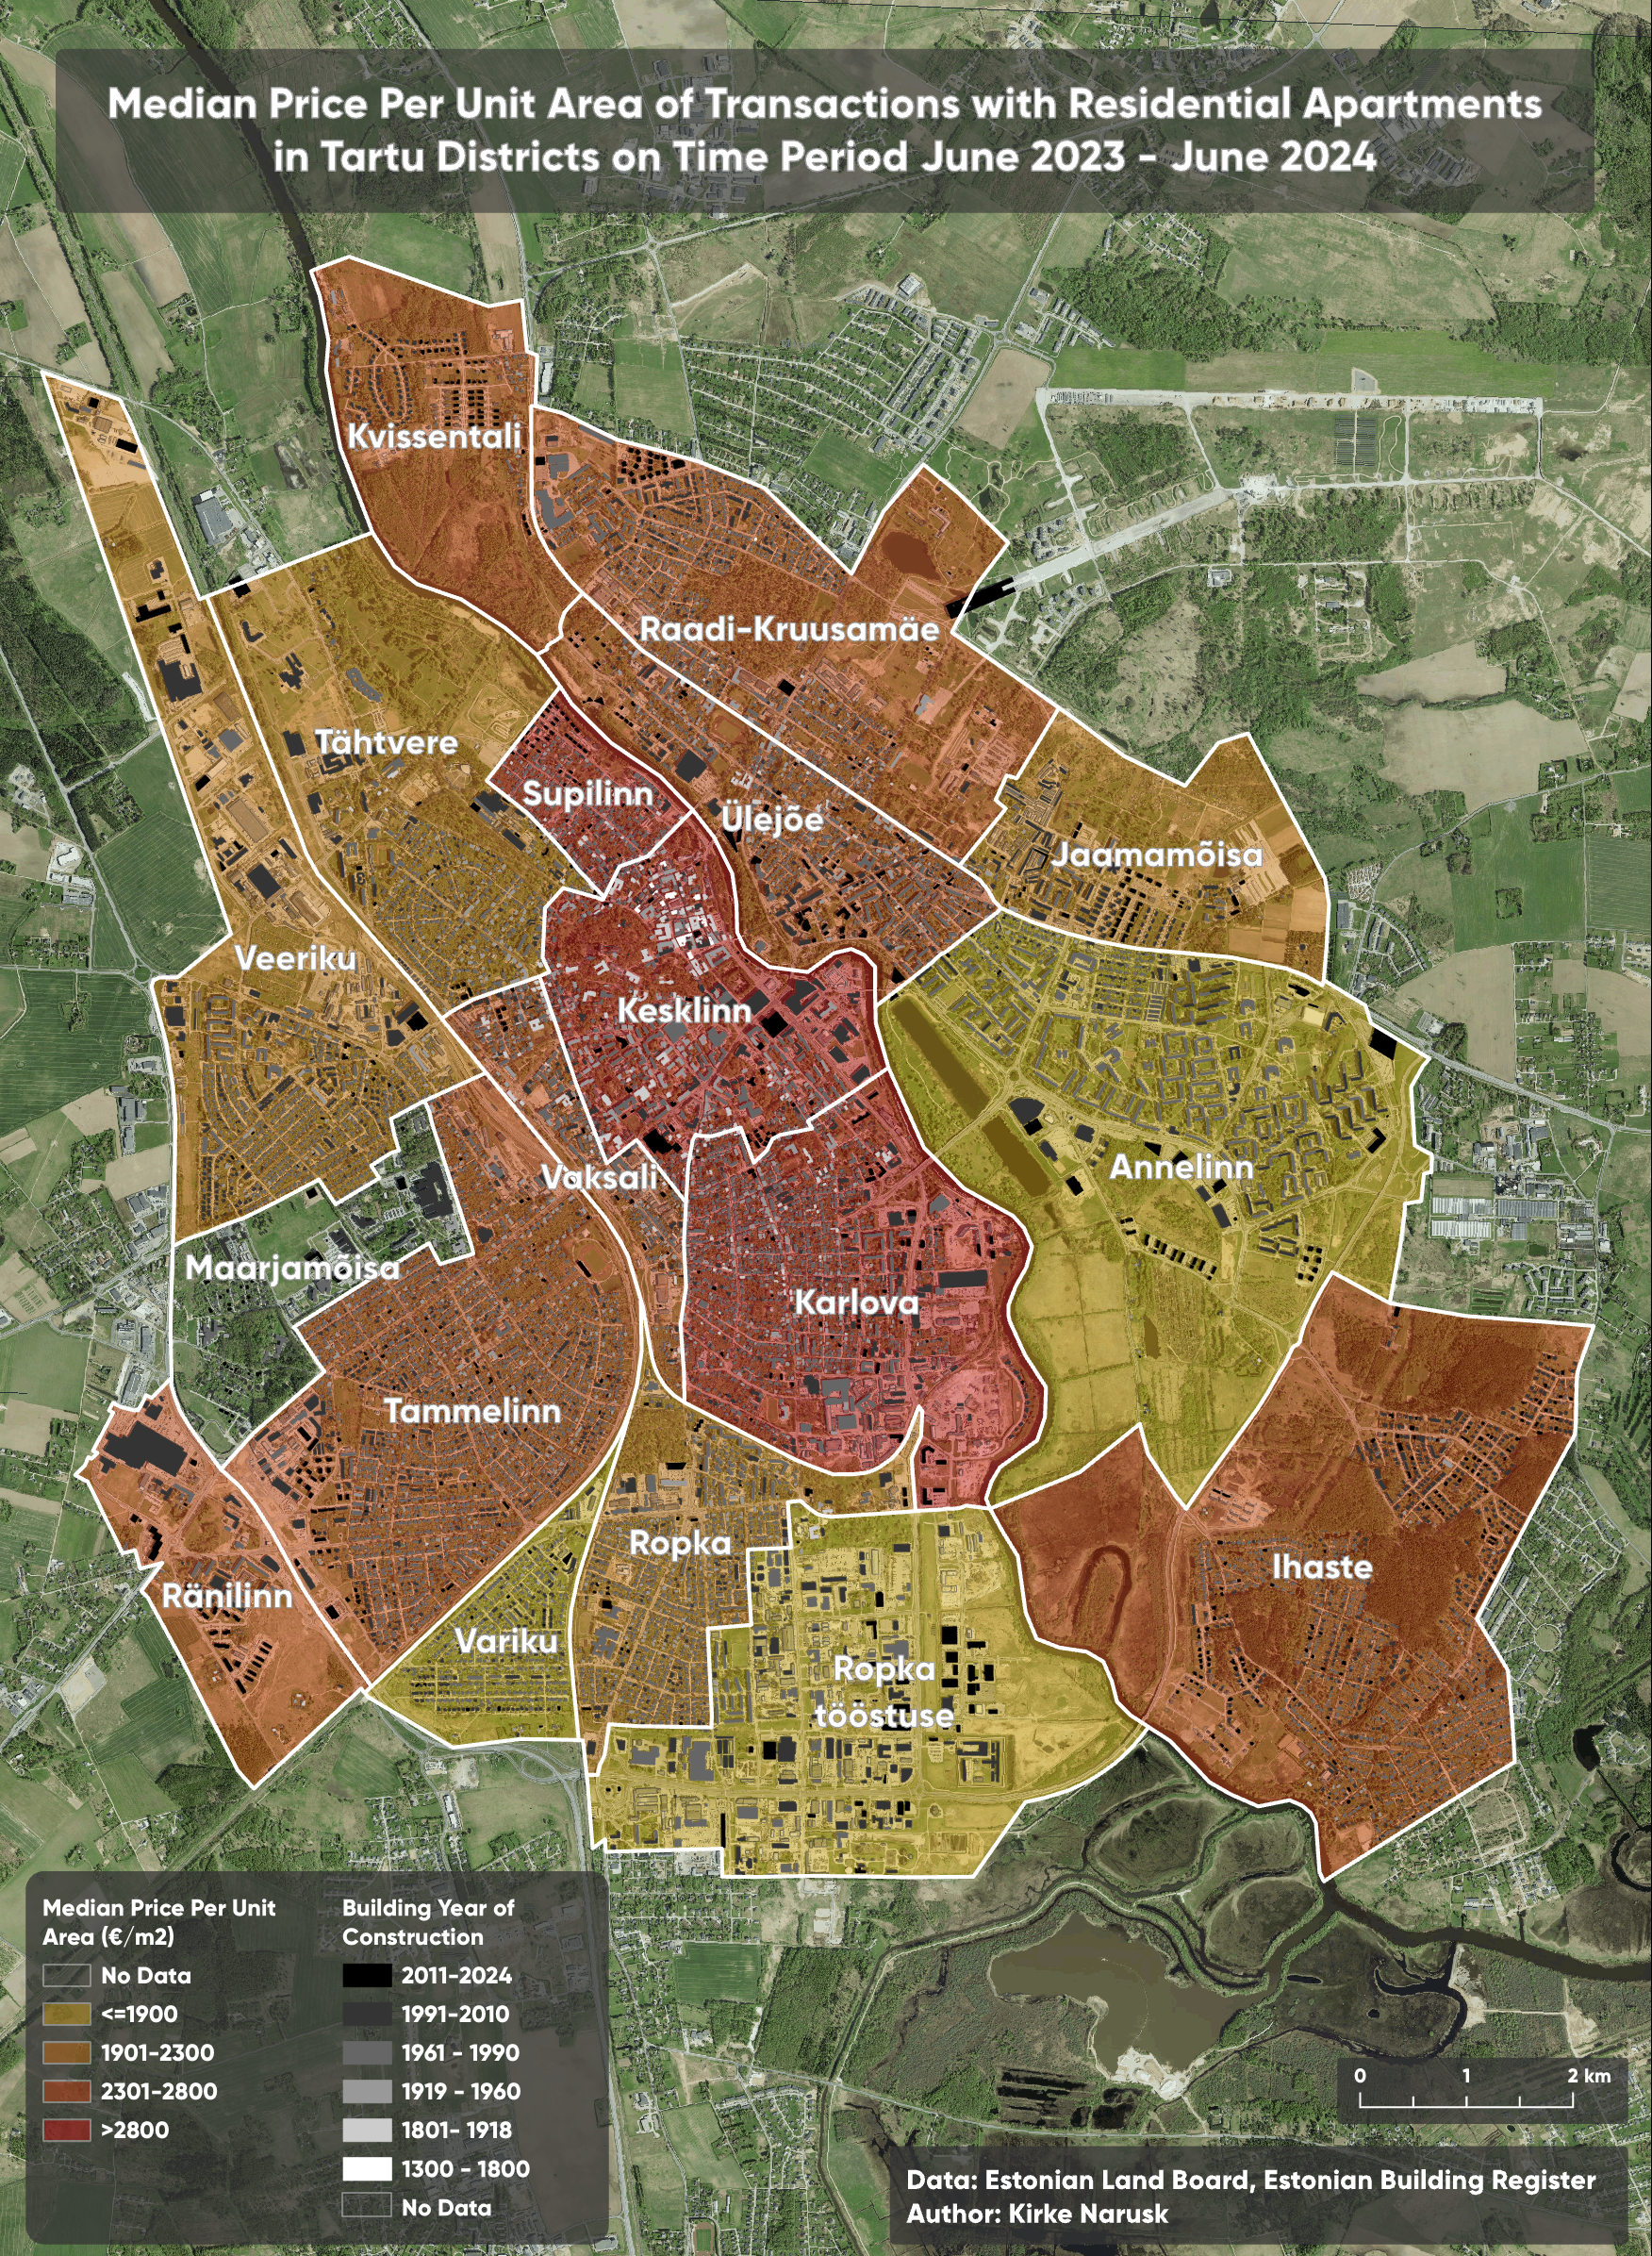
This map compares the median prices per square meter in Euros of residential apartments by Tartu districts. The data is collected on time period June 2023-June 2024. Buildings and their construction years are included as background information as well as a 10 cm orthophoto. All data used for the map is free open data from Estonian Land Board: real property price statistics(https://www.maaamet.ee/kinnisvara/htraru/FilterUI.aspx), buildings and their construction years WFS of Estonian Topographic Database + Estonian Building Register (https://gsavalik.envir.ee/geoserver/etak_tuletis/wfs?service=WFS&version=1.0.0&request=Getcapabilities)), Tartu districts (Place Name Register)(https://xgis.maaamet.ee/xgis2/page/app/knravalik)), orthophotos ([WMS](https://kaart.maaamet.ee/wms/fotokaart?).
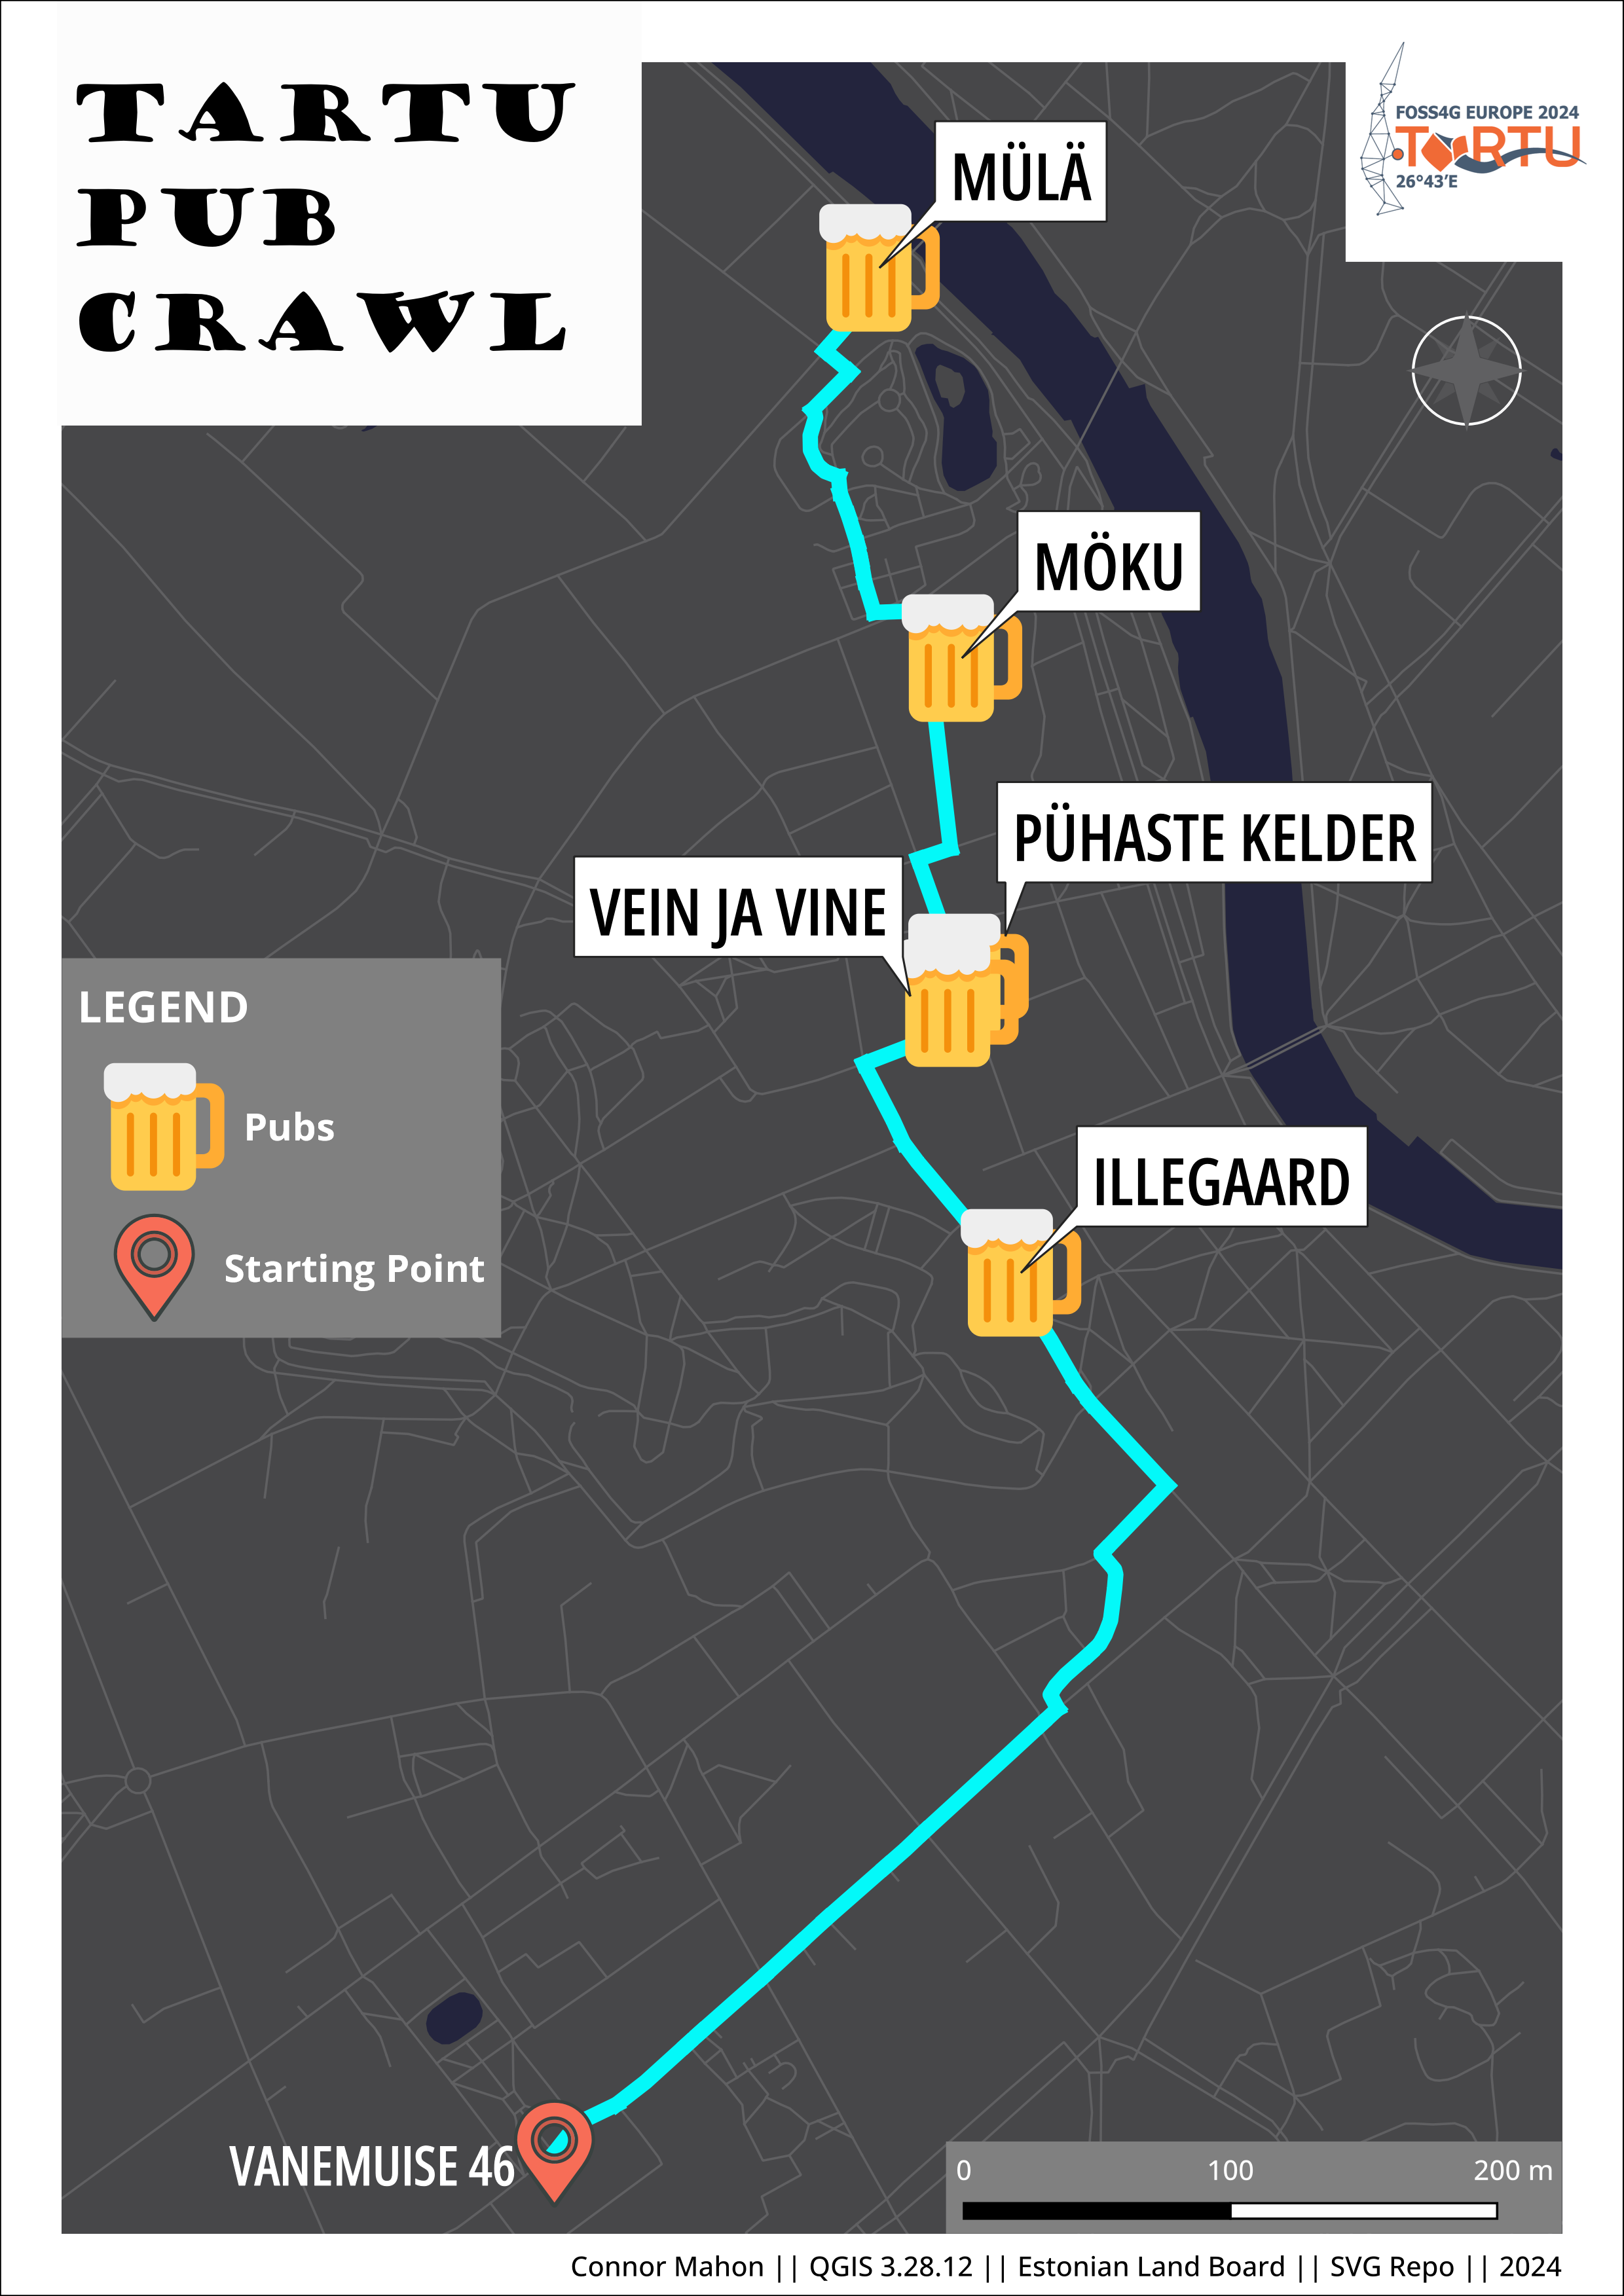
Connor Mahon, University of Tartu
What better way to get acquainted with a city than a pub crawl? As a Tartu resident of almost three years, I chose the pubs based on my preferences. In QGIS 3.28.12, I added OSM as the base map in order to create a new vector layer (points) and selected each bar as well as the starting point, Vanemuise 46. After, I added road data from the Estonian Land Board. I ran snap geometries to layer from the processing toolbox. Then, I ran the 'v.net.salesman' feature from the GRASS plugin to find the best route to hit each pub. I created another vector layer (points) and selected Vanemuise 46 to differentiate the starting point layer. Then, in the pubs layer, I used the 'select feature' tool to choose the location of Vanemuise 46 and deleted it. After I performed the analysis, I used SVG Repo to upload the beer mug and starting point icons under symbology.
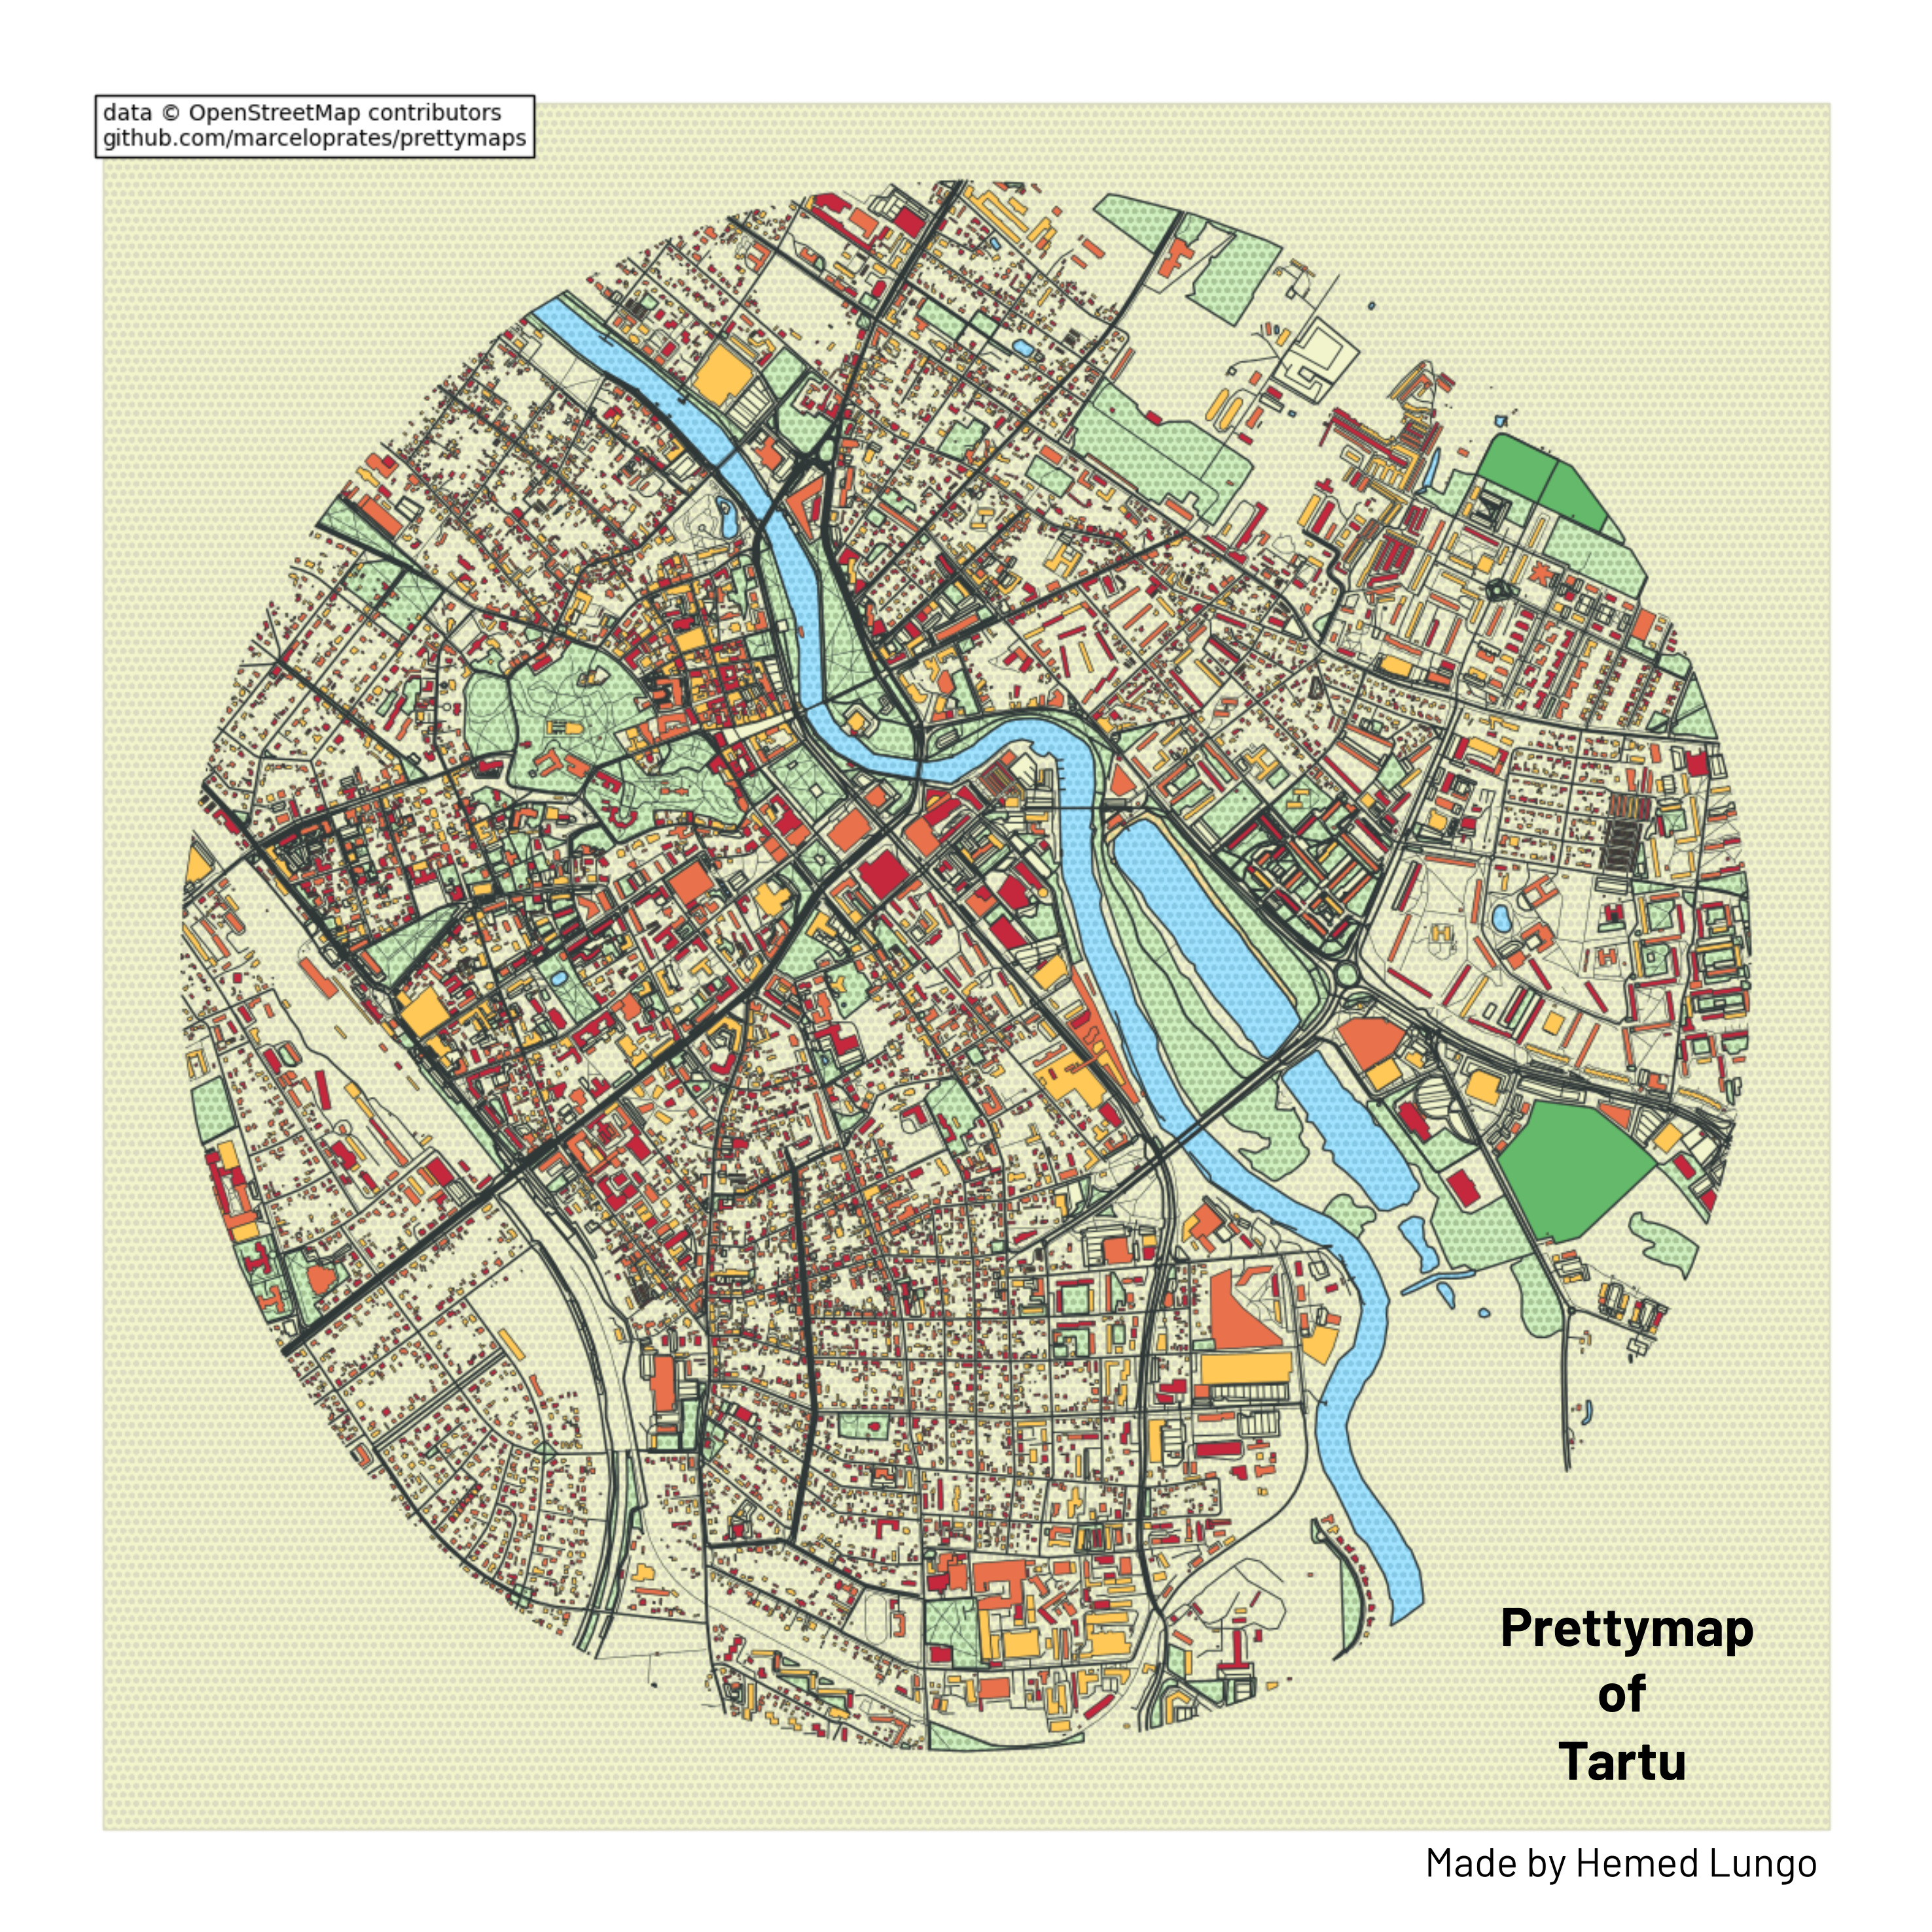
Hemed Lungo
The Map Was Generated using Google colab (Python codes Mainly) ,From Prettymap repository by Marcelo Prates with Openstreetmap dataset.
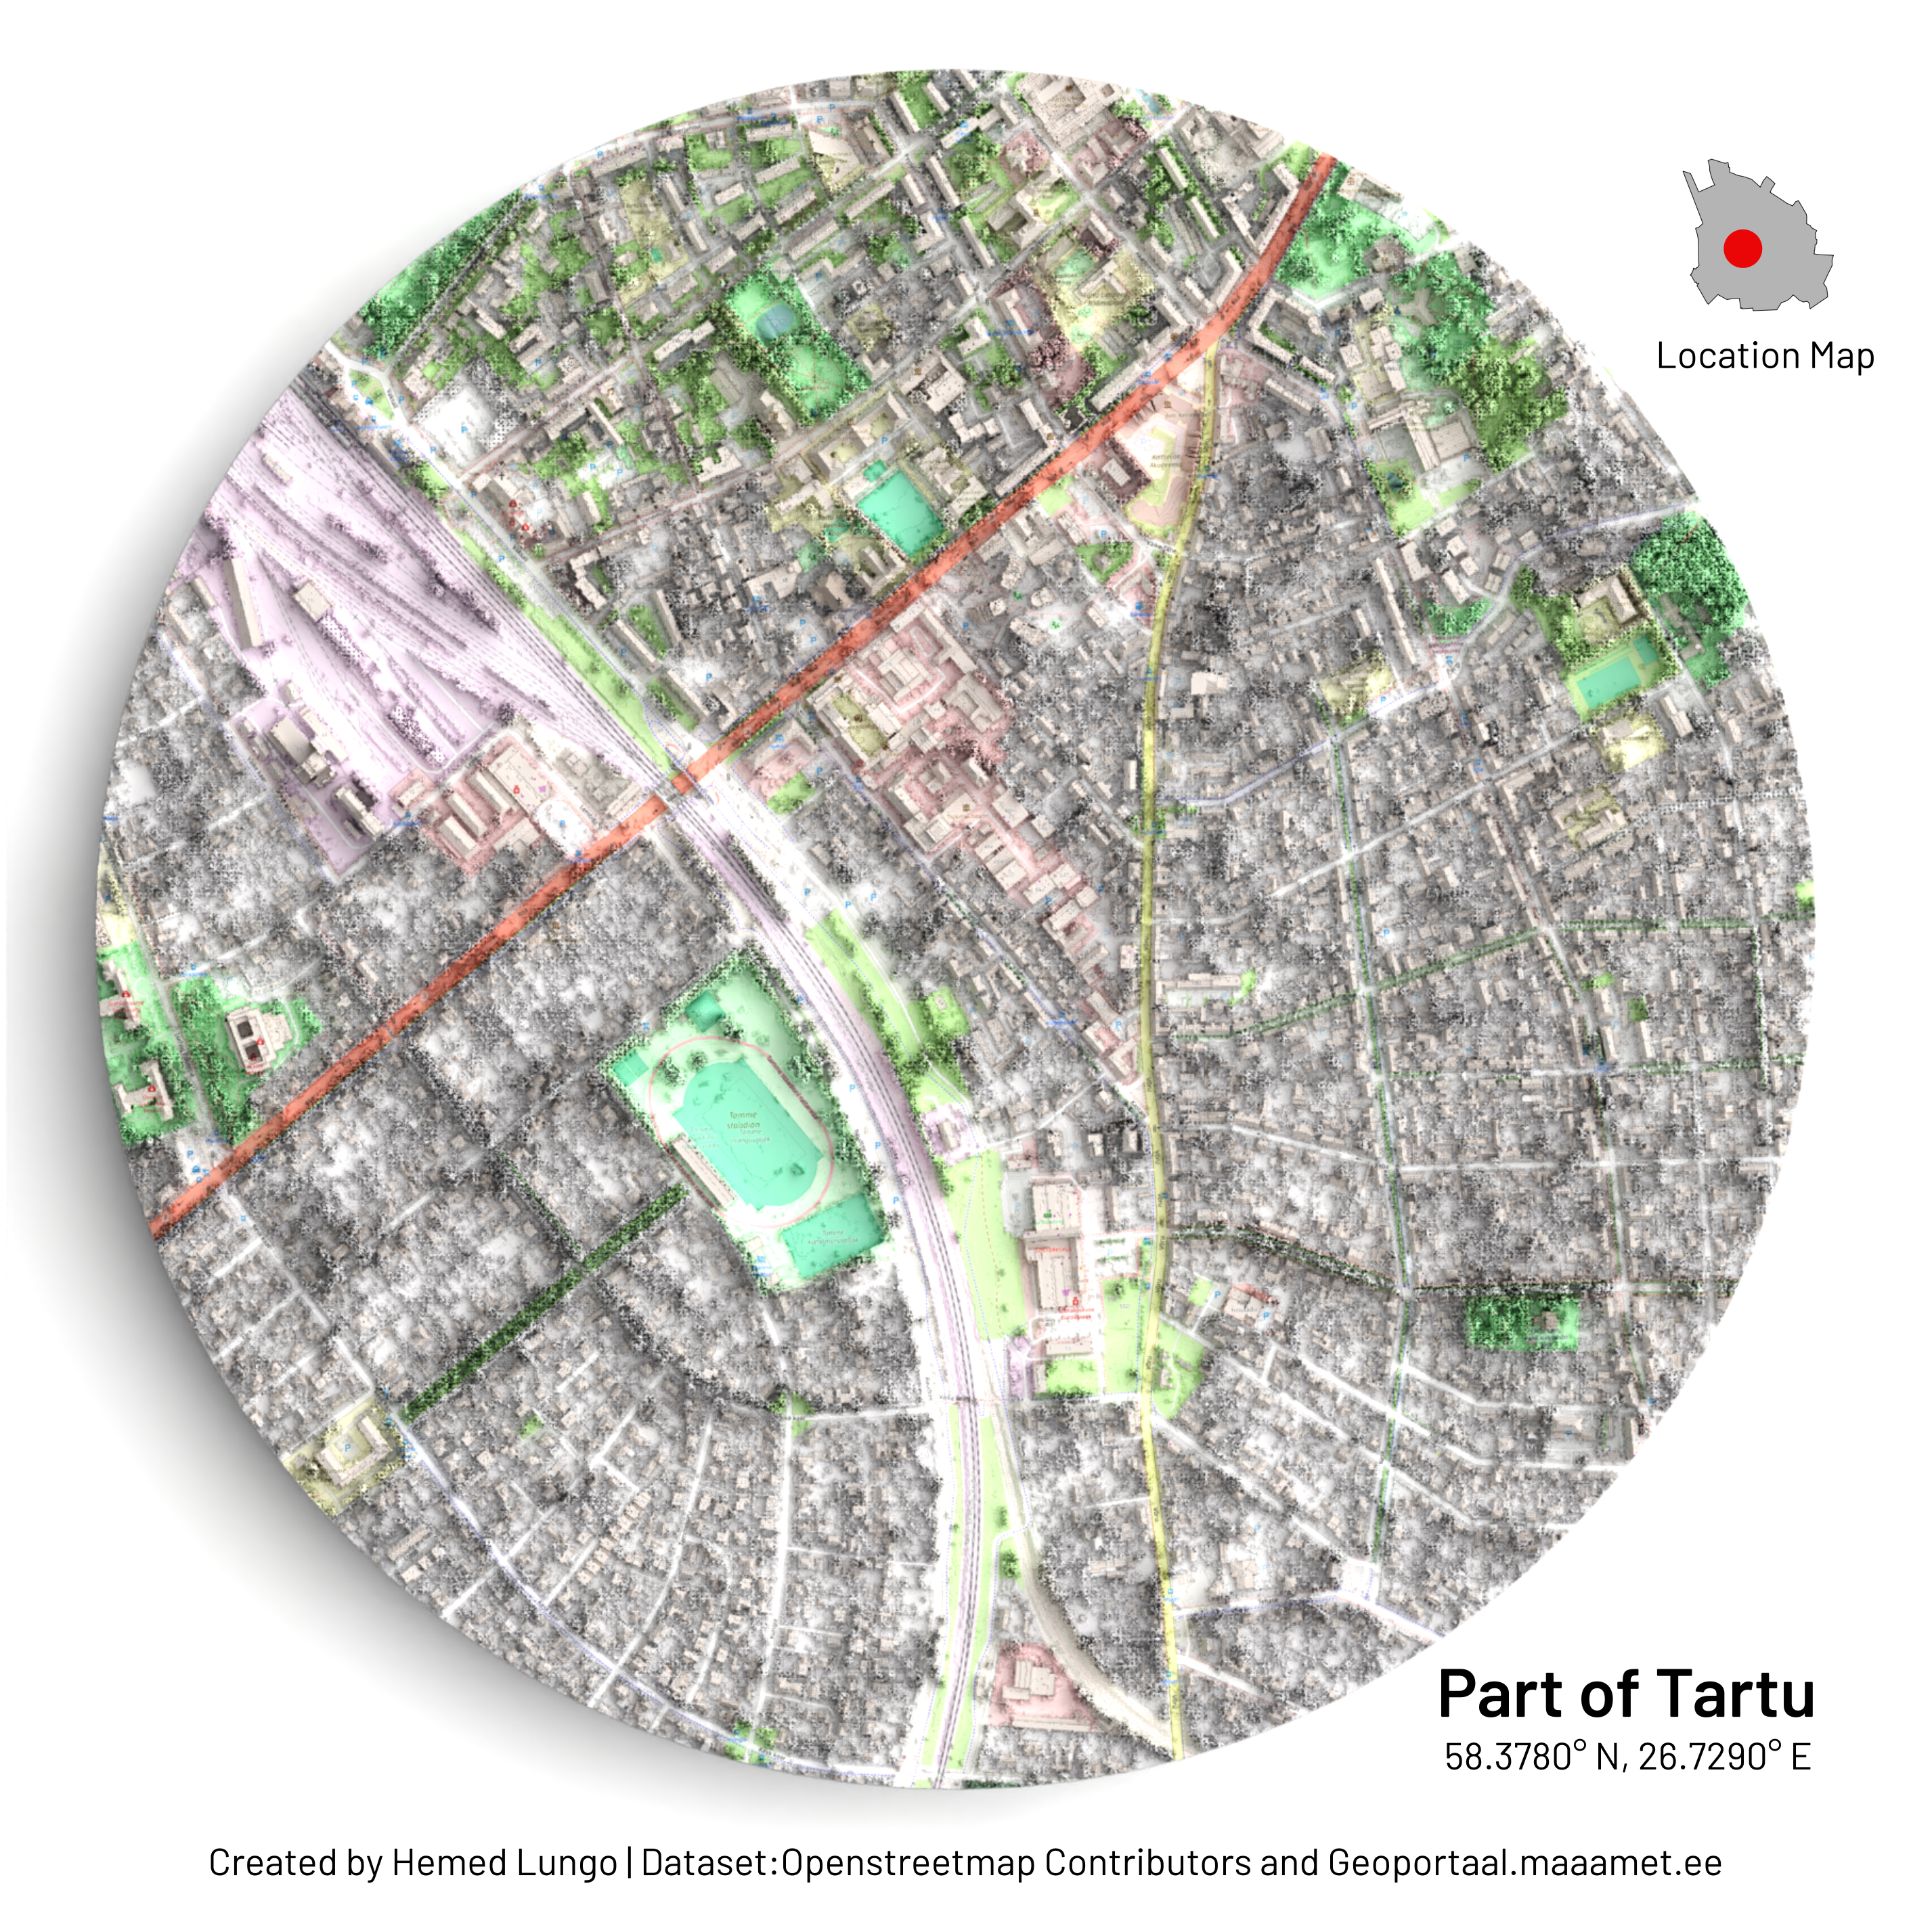
Hemed Lungo
Map was Crafted in Combination of Qgis and Blender (My Favorite FOSS Combination) ,QGIS was For Data Preparation and Final Touches and Blender for the 3-D effect.The Dataset are from geoportaal.maaamet.ee(Digital Surface Model) and Openstreetmap as Basemap.